Overview
Code Mode allows developers to customize or extend dashboards and presentations with unlimited functionality and design flexibility with the use of common coding languages. Code of all dashboard objects, dragged onto canvas in Visual Mode, is visible though this editor. Developers can enhance object functionality, customize it, and create their own UI objects and functionality from scratch here. Code Mode is also essential for editing certain code widgets, such as the Custom HTML widget, or Action Button functions.
Bilateral Editor
Code Mode edits are instantly visible in Visual Mode, so any interactive functionality added through JavaScript, or any customizations made to widget properties through HTML, or to the overall canvas design through CSS, will all be automatically synchronized with the visual editor and made available on it. Similarly, any changes made on Visual Mode will be instantly reflected in Code Mode.
Note that the code editor supports auto-saving, so users do not have to manually save any code changes.
Notes:
- Code Mode is available for Dashboards and Present.
- For Dashboards, Code Mode is only available on the canvas layout and is not supported in other layouts.
- Users will require a special “Code Mode” role function in order to use this mode. This ensures only authorized developers are able to edit dashboard code.
Understanding the Code Mode editor
The diagram below explains the features of Code Mode.

Number | Description |
|---|---|
1 | Use these buttons to switch between the Code Mode or Visual Mode. |
2 | This code editor allows you to write or edit dashboard code. |
3 | This button navigates to you to the HTML section of the code editor. |
4 | This button navigates to you to the JavaScript section of the code editor. |
5 | This button navigates to you to the CSS section of the code editor. |
6 | This list of objects shows all dashboard objects added to the canvas. Learn more. |
Object List
The object list on the left side displays all objects added to the dashboard. You can perform the following actions using this list:
- Hover over or click on an object name to highlight its code in the HTML section of the code editor. This makes the code easy to be discovered.
- Delete an object by using the delete icon next to it.
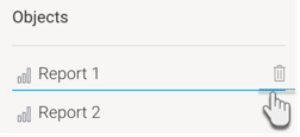
- View objects in the order they appear in the code editor. New objects are added at the end of the list, but if they are moved in the code editor, the list will be updated to reflect this. This makes it easy to look for the code elements in the editor, according to their arrangement.
Debugging made easy
Users get alerted to errors or mistakes in code with an error icon, as shown below.

Some Code Mode tips
- Test out your custom code functionality through the Preview mode. (Access to the Preview mode is gained via the ‘More’ button on the top-right of the dashboard editor.)
- Code functionality that you may want to reuse in other dashboards, can be saved into a Code Widget. Test it out here first, before packaging as a widget. The widget can be added through the plugin manager, and will appear in the dashboard builder’s Code Widgets list.
- To make it easier to code for specific objects, name each content dragged onto the canvas through the properties panel. This will also allow you to find objects more easily in Code Mode later.
Code Mode example
This section includes an example of a simple dashboard functionality using Code Mode. It includes code snippets that you may also use for yourself in your dashboard.
Scope: to create a report selector on a dashboard canvas that changes a chart based on the user’s selection.
For this we will add two action links to one side. Each link will display a different chart. When the user clicks on the other link, the chart will change.
Tutorial
For non-developer audience, here’s how to create this functionality by yourself:
- Add a canvas tab to your dashboard.
- Open the reports panel and drag 2 reports onto the canvas.
- Layer them on top of one another. You can use the report properties panel to make them of the exact same size, and position them at the same location. (This way the reports will switch at the exact same location when the user interacts with the dashboard.)
- Rename the first report you wish to display to ‘Report 1’, and the other to ‘Report 2’.
- Switch to Code Mode. You will be able to see the relevant code for both reports in the HTML section already.
Copy and paste the following code snippet into the HTML editor (right before the closing </canvas-area> tag). You do not need to change the widget-uuid of any objects, Yellowfin will automatically change that upon pasting into the editor.
This code snippet essentially displays a heading, and two “action links” to display the reports.
<text-title widget-uuid="59bee07d-e354-486b-a395-0dbbc6886a7b" width="202" height="34" left="41" top="170" line-spacing="normal" character-spacing="0" rotation="0" opacity="100" style="z-index: 4"><b xmlns="http://www.w3.org/1999/xhtml"><font color="#009eec">Code Mode Demo</font></b>
 </text-title>
 <text-simple class="link" name="Link 1" widget-uuid="0b286f5f-6dce-46c2-b7a4-d2832b035c29" width="102" height="29" left="41" top="214" line-spacing="normal" character-spacing="0" rotation="0" opacity="100" style="z-index: 5">See Report 1</text-simple>
<text-simple class="link" name="Link 2" widget-uuid="7a6f61b3-fd46-4952-9ee9-dbe2efd1b622" width="108" height="36" left="41" top="243" line-spacing="normal" character-spacing="0" rotation="0" opacity="100" style="z-index: 7">See Report 2</text-simple>
- You may switch back to visual mode to see the effects of the code snippet that shows a heading and 2 links/text.
Back in Code Mode, navigate to the JavaScript section, and copy the following code segment there:
This code defines a function in which Link 1 will display Report 1, and Link 2 shows Report 2.
let link1 = this.apis.canvas.select('Link 1'); let link2 = this.apis.canvas.select('Link 2'); let report1 = this.apis.canvas.select('Report 1'); let report2 = this.apis.canvas.select('Report 2'); $(report2).css({ display: 'none' }); /* Use external libraries and custom scripts */ requirejs(['jquery'], function($) { link1.addEventListener('click', (e) => { $(report1).css({ display: 'initial' }); $(report2).css({ display: 'none' }); }); link2.addEventListener('click', (e) => { $(report1).css({ display: 'none' }); $(report2).css({ display: 'initial' }); }); });- Now preview your code to test it. Click on the More button on top of the dashboard editor and select Enter Preview Mode.
- You will see the dashboard you designed with only the first report displayed. Click on ‘See Report 2’, to see the report change, and vice versa.