Overview
There are three types of table layout available:Layout | Description |
|---|---|
Column | The most common form of table output, all fields added are displayed as a column in the table layout, with the field name used as the column header. |
Row | A variant the column layout, all fields added are displayed as a row in the table layout, with the field name used as the row header. |
Cross Tab | A special layout that allows you to summarise data by using both Column and Row headers with Metric fields making up the body of the table. This display is sometimes referred to as a Pivot. |
Column Based Tables
Yellowfin tables display data in either rows or in columns and have a header and footer. Header and footer rows and columns are special rows and columns. The header displays information about the row or column e.g. a label or the name of the variable whose values are displayed. The footer displays calculations on the values displayed in the columns or rows.You can display the variable labels along the top row of the table so that you read the data down the columns as shown below:
When to Use Column Based Tables
A column table is a sequential, two-dimensional list. This doesn't imply that the data in a table is simple or uncomplicated: you can present a great deal of data in a table. The layout of columns within a table is directly related to the layout of the items within the columns data list. Yellowfin places the cells in the table in the same order in which they appear in the report columns list.
Suitable for - Presenting data in a tabular, two dimensional list.
Note: arrange the items in the order you want them to appear in the column list. For example, if you want each row to have a location, headcount and basic pay, in that order, arrange the data items in that order in the Columns list.
Row Based Tables
Row based tables allow you to have the variable labels displayed down the left edge of the table so that you read the data across the rows as shown below. This table format is typically used in financial reports or where the value of a field needs to be highlighted.They are also often used to list information based on a particular customer, site, product, using sections so that there is a table of information for each item. See the example below:
When to Use Row Based Tables
A Row table is similar to a Column table, but the header and information are displayed vertically, instead of horizontally. When you set the report type to Row, the Row Edit Field looks identical to the Dimensions Edit Field. However, when the report is run the data will be displayed in rows rather than columns.
Suitable for - Presenting data in a vertical format.
Note: arrange the items in the order you want them to appear in the Rows list.
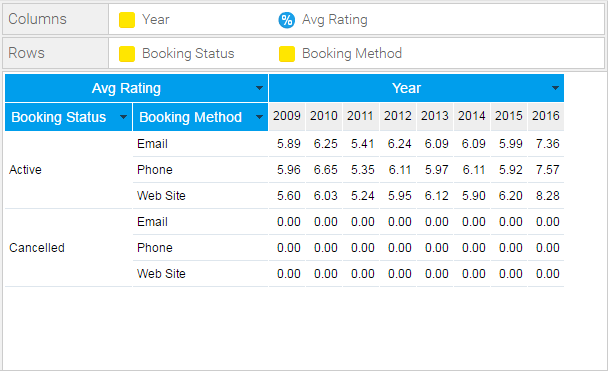
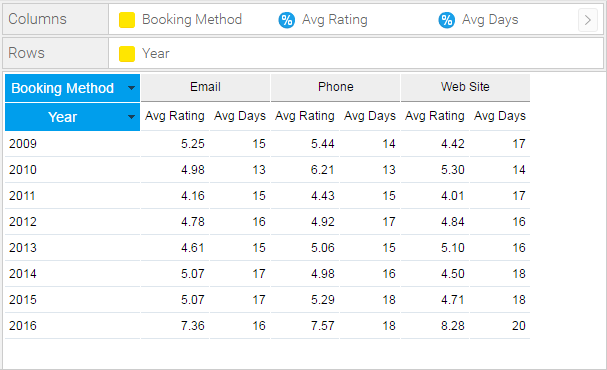
Cross Tab Tables
You can create a cross tab report to present data more clearly. A cross tab report shows a summary value at the intersection of each row and column.The example below displays the average camp rating broken down by year and booking method.. The values at the intersection points of rows and columns show summarised information.
Note:
- arrange the items in the order you want them to appear in the Column and Row lists.
- metric items cannot be used in the vertical or horizontal headers; they can only be used in the body of the cross tab table.
- metrics can be added to either the Columns or Row lists in order to populate the summary body of the table, but if using multiple metrics they must all be added to the one list.
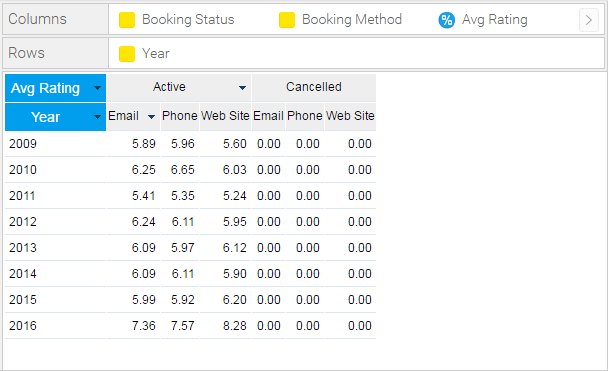
Advanced Cross Tabs
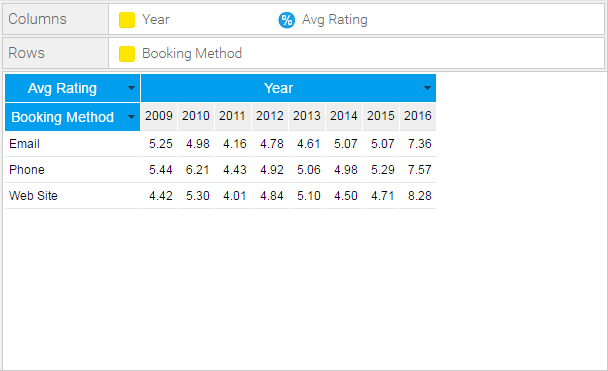
To create more advanced cross tab tables you can add additional metrics or dimensions to your report data. However, consideration needs to be taken into account of the complexity of the data output that is being created.Two or More Measures in the Cross Tab
To include more than 1 metric in your cross tab table drag an additional metric next to the original in the same list (either Columns or Rows).
Columns
Rows
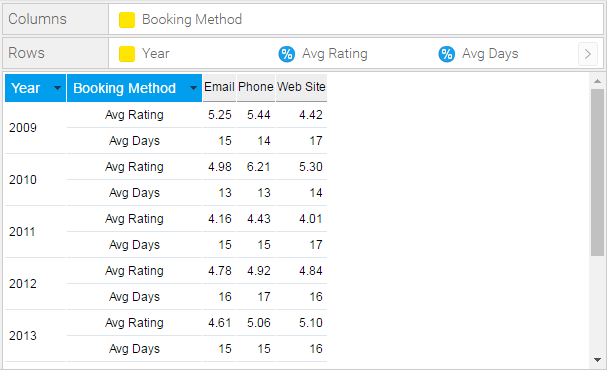
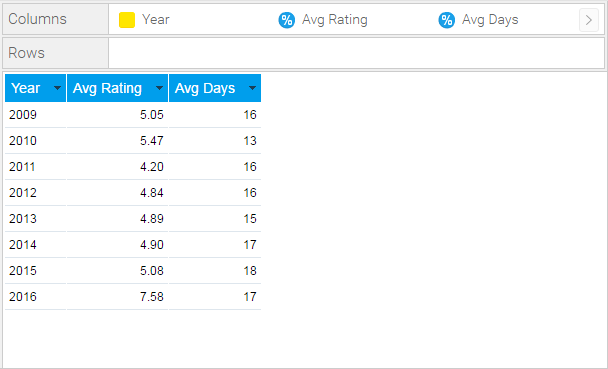
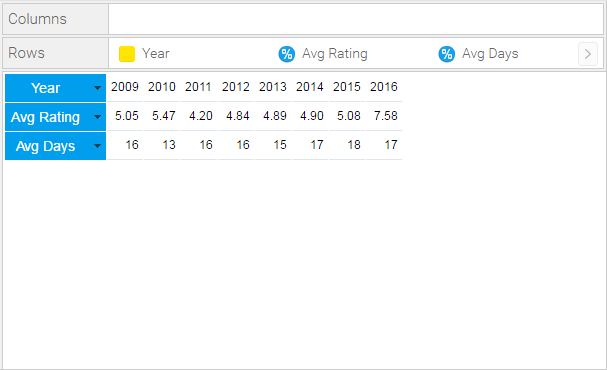
Two or More Dimensions
To include more than one Row or Column Dimension onto your report drag an additional dimension into the Rows or Columns list.
Columns
Rows