What is the Yellowfin JavaScript API?
The JavaScript API (JS API) is a tool that allows third party developers to embed and manipulate Yellowfin content. Generally when someone refers to the JS API they are referring to the embedding functionality.
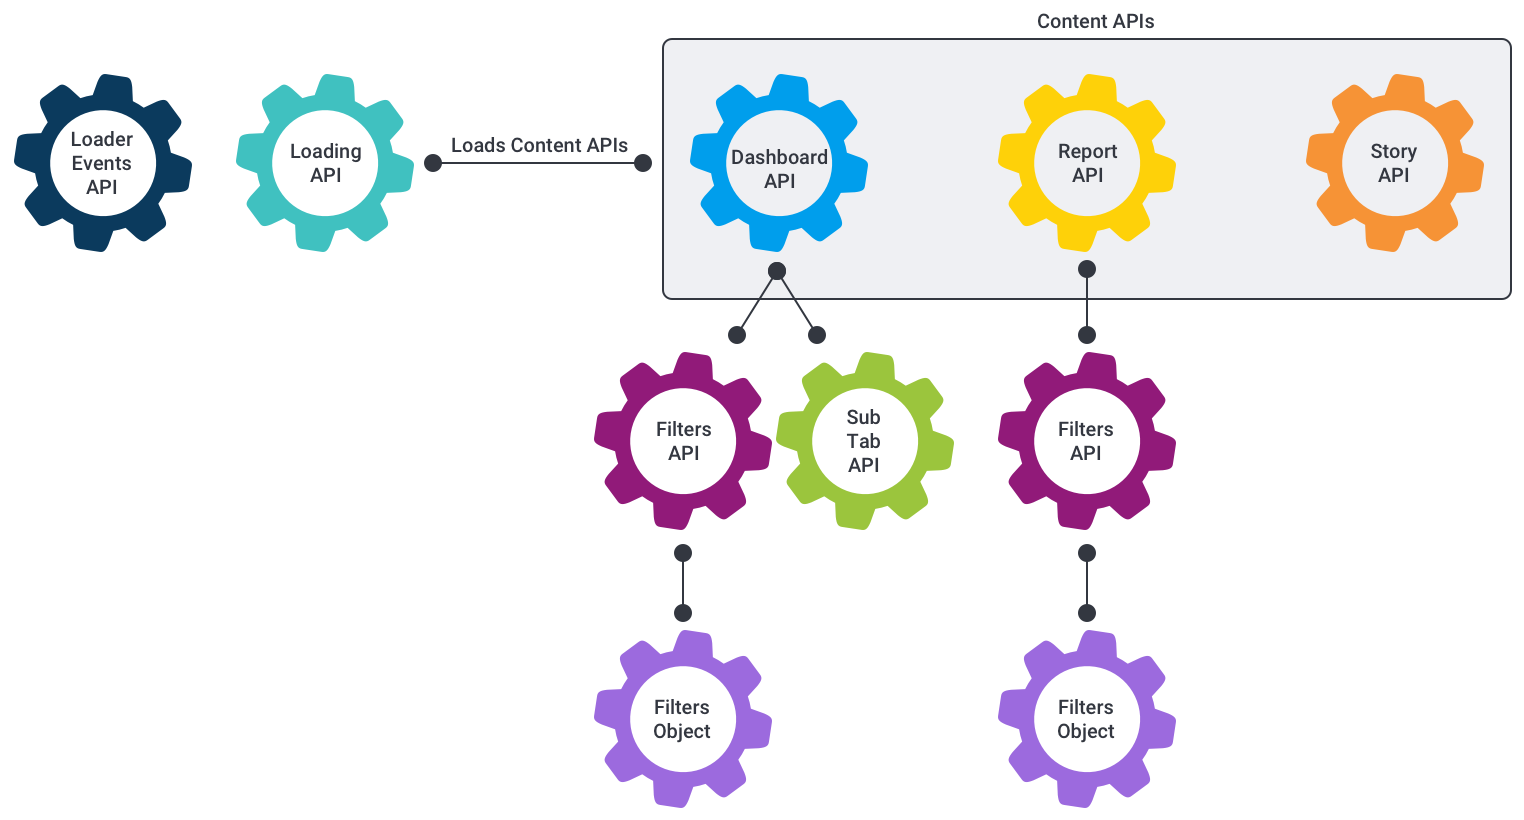
The JS API is made up of a lot of parts. There are two broad API types that objects fall into when talking about the JS API — Loading APIs and Content APIs.
Loading APIs
These APIs essentially allow you to load content, such as a report, dashboard or story. They don’t provide too much functionality except for loading the Content API for the object you asked for.
yellowfin.reports.loadReport({ reportUUID : ‘auuid’ })
As of 9.6, loading APIs are almost exclusively available through the external JS AP only. These are the dashboard, story and report loading APIs. They all provide a single loadContent (loadReport, loadDashboard and loadStory) function.
All of these functions execute asynchronously and return a promise which will resolve with the loaded Content API after the content has loaded.
Content APIs
Content APIs are the actual content — and they cover a much broader range of types. Currently there are three top-level Content APIs which are Story, Dashboard and Report. However they all contain child objects that make them much more complex.
Both Report and Dashboard APIs will contain a Filters API if the content has been configured to have filters. This allows developers to get access to filter objects and manipulate them via code, or react to their events.
Report API
The Report API provides access, via code, to most of the functionality that a user can perform on a report. Nearly all user interactions that occur on a report are now directed through the Report API — with the exception of table controls (navigating between pages and sections) and drill through.
This means that a user should be able to perform via code nearly any action they can perform in the UI, including applying time slider values, unit selection, series selection, sorting, drill down and drill anywhere. All of these interactions also have an event associated with them, so developers can listen for these events occurring. They will be triggered whenever the event occurs (whether via a code call or UI interaction).
Ideally, our code functionality should fully match our UI — and future interactions that we implement should be implemented via the API first, and then have the UI built around that.
The Report API will listen to its Filters API for any changes to the filters applied values; if they occur, the API will trigger a re-run of the report. This trigger incorporates a short delay (100 milliseconds) before re-run so that multiple changes can be made to a report simultaneously.
Output types
The Report API also provides the ability to retrieve an “output type” for a report, using the registerOutputType functionality. The registerOutputType adds a request to a report run which will say “also return this information” and provides a callback to be passed in. This means that if the report’s filters are changed and a new run is triggered, the passed callback will be completed when the new result is completed.
This allows developers to retrieve report datasets, unique values for columns and may allow other functionality to be returned in coming releases.
Dataset
The dataset output type returns the entire dataset for the report. This will be in a particular data order and only contain data. The Report API provides a function (getFieldsInDatasetOrder()) which will return all of the reports fields in dataset order, which means you can match a field to its data based on its array position.
uniqueValues
The uniqueValues output type returns all of the distinct values for any passed fields. This is particularly useful for developers who wish to fetch all of the values for a particular dimension that would return a result if they were applied as a filter.
Display
The Report API also provides functionality to create visualisation elements based on the report.
The function report.createReportElement(options); creates a visualisation of any chart, table or canvas that is present on that report. It displays them simultaneously (so Chart A and Chart B can sit next to each other).
Dashboard API
A Dashboard is built upon many subtypes — sub tabs, reports, filters, canvases and widgets.
A dashboard is a collection of sub tabs. Each of these sub tabs contains either:
- a canvas, which allows placing of many reports and widgets; or,
- a grid layout which has reports, filters and certain widgets.
The Dashboard API helps to keep track of what page the user is currently on and provides a Filters API which has the state of any filters on the dashboard. All the reports that are loaded on a dashboard listen to this Filters API, so provided the filters are linked, the Report API will just listen for its filter changes, just as it would when embedding a report without a dashboard.
Sub Tab API
The Sub Tab API provides metadata about the passed dashboard tab. This API doesn’t provide many functions that can be called, but it can find all the reports on a sub tab and retrieve the Canvas API if there is a canvas.
Filters API
The Filters API provides a representation of the filters on a particular piece of content. It provides functionality to set or retrieve filter values, as well as updating the possible values that can be used for cached reports.
The API contains a set of FilterObjects, which are the API objects for each individual filter that is available on the piece of content.
It also provides functionality to create filter list elements. This lets you place the Yellowfin filter lists anywhere on a page and offers the option of customising which filters will be displayed within that filter list.
The Filters API also lets you listen for any change in filters across the entire Filters API, so you can react to any filter on the content changing.
The Filter object
This object is a representation of an individual filter, within the Filters API. It’s used to maintain the state of the filters and trigger events when a filter value changes.
A filter has two sets of values, described in the following table.
Value type | Description |
|---|---|
Applied values | The values applied to the report or dashboard, used in any queries that Yellowfin generates when running the report. |
Staged values | The current values visible to the user in the report or dashboard. Once an apply() function is called on the Filter Object or Filters API, these values will be copied to the applied values. |
The Filter Object also provides functionality to create an individual display representation of the filter itself. This uses the same styling that a normal Yellowfin filter would, but it is completely independent of a filter list.
Loader events
The Loader Events API lets you listen for standard Yellowfin loading events and react to those events.
This allows you to prevent the loader from being added, or to attach it to a different element when detected. For example, if you have a canvas with many reports, instead of attaching a loader to each report on the canvas, you could attach it to the overall canvas object and then remove the loader when all of the reports have finished rendering.
Internal vs external JS API
What does this mean?
“Internal JS API” refers to the tools used by a developer who is logged into Yellowfin, using Yellowfin code mode, a custom header or JavaScript Charts.
“External JS API” refers to the tools used by a developer embedding Yellowfin content into an external page. Prior to Yellowfin 9.7, the two APIs provided different toolsets. From Yellowfin 9.7 on, most of the JS API functionality is available to users who are logged into Yellowfin.
Both JS APIs give you access to all of the Yellowfin Loading APIs and Content APIs so you can load any piece of content you wish, provided you know the content’s UUID.
In most cases, you can create a report or dashboard listing service using Yellowfin webservices to fetch Yellowfin content objects, and then use the UUIDs provided from those objects to load the object in the JS API. This makes it possible to build a completely custom UI while using Yellowfin reports, dashboards, stories and Guided NLQ within them, so the content building can be done by non-developers.
Considerations
Authentication can sometimes be problematic because the Yellowfin server is treated as a third-party application. Browsers that reject third-party cookies on a site therefore reject the Yellowfin JS API (Safari and Chrome in Incognito mode). In addition, security changes around the “Same Site” Flag makes it difficult to configure a web server to accept all the cookies that are required.
In addition, only the External JS API provides the following functions:
- logoff()
- newSession()
- init()
Note that the Internal JS API does not require init() because it can be fully loaded when a Yellowfin page loads.
How do I access the internal JS API?
When loading a page within the Yellowfin Application, a JsAPI object is added to the page’s window object. Developers can then access this using Custom Headers, Code Mode or JavaScript Charts.
For example:
window.JsAPI
//Or Simply
JsAPI
This can be then used to load other content.
Load a report
Load Report options can be found on the Advanced API wiki page.
JsAPI.loadReport({
     reportUUID: 'the-uuid-to-load',
     element: document.querySelector('#myInternalReport')
});
Load a dashboard
Options for loadDashboard can be found on the Advanced API wiki page.
JsAPI.loadDashboard({
     dashboardUUID: 'dashboard-uuid-to-load',
     element: document.querySelector('#myInternalDashboard')
});
Load a Story
Options for loadStory can be found on the Advanced API wiki page.
JsAPI.loadStory({
    storyUUID: 'story-uuid-to-load',
    Element: document.querySelector('#myInternalStory')
});
Load Guided NLQ
Options for loadNLQ can be found on the Advanced API wiki page.
JsAPI.loadNLQ();
OR
JsAPI.loadNLQ({
element: document.querySelector('#myNLQContainer')
});
Examples
Example 1: slide-out dashboards
Below is an example for loading a dashboard when a button is clicked on the dashboard.
HTML
<canvas-area xmlns="http://www.w3.org/1999/xhtml" canvas-uuid="e3db80a5-5f8f-4ae9-887d-f26ed1fecc2d">
    <text-title publish-uuid="906b4057-e4c6-4913-8624-84c2f6596c26" width="959" height="141" left="25" top="9" line-spacing="normal" character-spacing="0" rotation="0" name="Title" on-click="none" style="z-index: 2;"><div>Example Dashboard that demonstrates opening the Sales Performance Dashboard in a slide out</div></text-title>
    <canvas-button publish-uuid="9c97e800-3dbb-477a-9cc4-398194ab6888" width="222" height="102" top="150" left="35" plugin-name="com.hof.mi.widgetcanvas.widgettemplate.CodeButtonTemplate" text-color="#333740" name="DashboardButton" on-click="none" style="background-color: rgb(219, 221, 229); border-radius: 0px; border: 2px solid rgb(219, 221, 229); z-index: 2; opacity: 1.0;"></canvas-button>
</canvas-area>
CSS
* div.embeddedDashboard {
    width:600px;
    height:100%;
    position:fixed;
    top:0;
    right:0;
    overflow:auto;
    background:white;
    padding-top:50px;
    z-index:100;
}

* div.embeddedDashboard div.closeIcon {
    position:absolute;
    right:0;
    top:0;
    width:50px;
    height:50px;
    z-index:10000;
    background-image: url('images/close_popup_grey.svg');
    background-repeat: no-repeat;
    background-position: center;
    cursor:pointer;
}
JavaScript
let canvas = this.apis.canvas;

//In this example the dashboard is Sales Performance, this can be changed to whatever dashboard is required.
let Dashboard_To_Load = 'e7409ff2-f846-44e1-a603-b78ec51b20b9';


this.onRender = function () {
    //Get the Canvas Button from the Page.
    let button = canvas.select('DashboardButton');

    //Add an event listener so when it is clicked, we can display the Dashboard_To_Load
    $(button).on('click', () => {

        //Create a Dashboard Element
        let $dash = $('<div/>').addClass('embeddedDashboard');

        let $closeIcon = $('<div/>').addClass('closeIcon');
        $dash.append($closeIcon);
        $closeIcon.on('click.closeDashboard', function() {
            $dash.remove();
            $closeIcon.off('closeDashboard');
        });
        $('body').append($dash);

        JsAPI.loadDashboard({
            element: $dash[0],
            dashboardUUID: Dashboard_To_Load
        });
    });
};

/**
* Called when the canvas and all its child elements are removed from the page.
*/
this.onRemove = function () {
    // Insert your code here. This is an ideal place for removing event listeners
};