Overview
Include
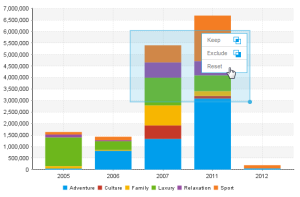
- Click and drag to highlight an area on the chart
- Select the Keep option
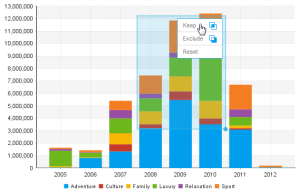
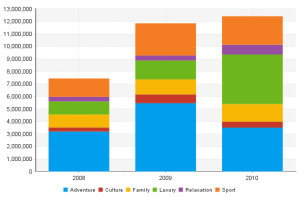
- You will now notice that the chart has been restricted to only the values you selected in the highlighted range
Exclude
- Click and drag to highlight an area on the chart
- Select the Exclude option
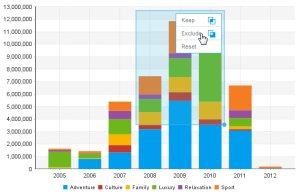
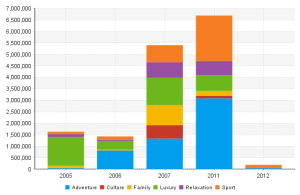
- You will now notice that the chart has removed the values you selected in the highlighted range
Reset
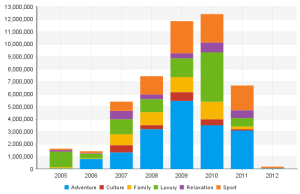
- Click and drag to highlight an area on the chart
- Select the Reset option
- You will now notice that the chart has been returned to its original state
Incompatible Charts
- Histogram
- Z Chart
- Maps
- Meters
- Waterfall
- Event
- Week Density
- Trellis (not compatible with exclude brushing)
- Auto Charts (not compatible with exclude brushing)
Note: chart brushing is not available when Drill Anywhere or Drill Through is enabled.
Limitations
Chart brushing will not be available in the following cases:
- The user has the Active Charts content setting option turned off.
- The chart is being repositioned on the design page.
- There is a time slider on the time series charts.
- There are analytic chart fields (Trend, Average, Accumulation, and Forecast) added to the chart.
- The chart is part of a multi-chart report.
- The chart is embedded in a separate location using the JS API.
- The chart is being edited in the Chart Builder.