Overview
Type | Icon | When to Use |
|---|---|---|
Vertical Column |
| You want to highlight values for easy comparison and plot your numbers vertically. Use a column chart to place less emphasis on time and focus on comparing values. |
3D Vertical Bar |
| Similar to the vertical bar chart, but in three dimensional form. |
Stacked Vertical Bar |
| Also referred to as stacked column charts and used when part-to-whole comparison is important. |
Cylinder |
| Similar to the vertical bar, but having chart components shown in cylindrical form. |
3D Stacked Vertical Bar |
| Similar to the 3d stacked vertical bar chart, but in three dimensional form. |
Layered |
| Compares the contribution of each value to a total across categories. |


Chart Data Options
Option | Description |
|---|---|
Horizontal Axis | This is the category label for the X axis |
Vertical Axis | Typically a numeric value such as $. An item that you want to measure on your Chart |
Colour | This option is only available if you have a cross tab data set available and is used to determine the colour applied for cross tab series data. |
Column Chart Tutorial
Summary
In order to set up a Column Chart you will need:
- Create a report with chart display
- Select a field to use as the Horizontal Axis
- Select a field to use as the Vertical Axis
- Select a field to use as the Colour (if you have decided to create a cross tab report)
- Create your chart, selecting Column as the type
- Provide the Horizontal Axis, Vertical Axis, and Colour options
- Customise the Chart as required
- Proceed to the Output step
- Save your report
Tutorial
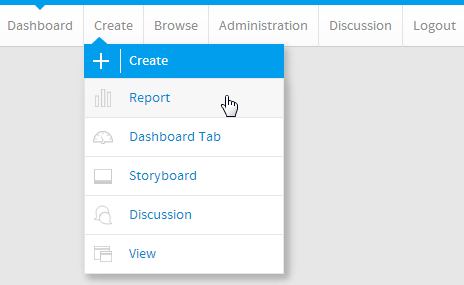
1. Click the Create link in the main navigation bar of the system, and select the Report option.
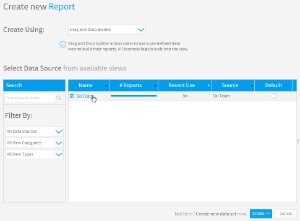
2. You will now be on the Report Initialisation page. Ensure the Drag and Drop Builder has been selected to use for report creation.
3. Click on the Ski Team view in order to use the fields defined within it for creating the report.
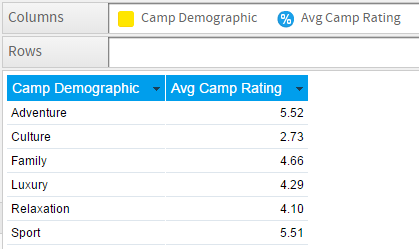
4. Add Camp Demographic and Camp Rating to Columns.
5. Proceed to the Charts step of the builder.
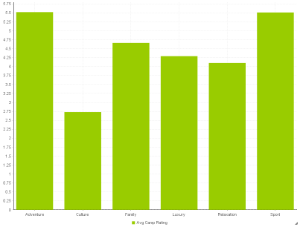
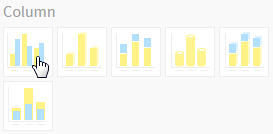
6. Select the Vertical Column chart from the Column section of the charts panel on the right of the screen.
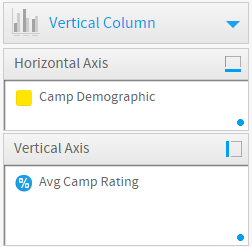
7. Set the following components:
- Horizontal Axis: Camp Demographic
- Vertical Axis: Avg Camp Rating
8. Save your report