Overview
The Charts step of the Report Builder has multi-chart functionality which provides the user with the option to create multiple charts based on the one report result set. These charts can then be displayed together through the use of the Canvas set up through the Design step.The benefit of Multi-Charts is the reduction of queries run on the database. Traditionally each report could only have a single chart based on it. This meant that if you wanted to examine the results of a report through different visualisations you would have multiple reports. Through the use of multi-charts several visualisations can be presented with a single database query. Multi-Charts also mean that a dashboard-style display can be created at the report level if desired.
Multi-Chart Creation
The creation and formatting of multi-charts is the same as a single chart. The only difference here is that you will make use of the chart list at the bottom of the builder.
Add Chart
Once you have set up your first chart, using the same process as a single chart report, click the + Add Chart button to the right of the Chart Thumbnail list at the bottom of the Charts page.
You will now be presented with an empty Charts step and can begin building your second chart.
Select/Edit Chart
Once you have more than one chart in the Charts step, you may find that you need to navigate between them in order to apply editing and formatting changes. To select a different chart to work on, click on its thumbnail in the Chart Thumbnail list in the bottom of the Charts step.
Copy Chart
If you would like to make a duplicate of a chart, which you can then edit, hover the mouse over its thumbnail in the Chart Thumbnail list at the bottom of the Charts step. You will now be able to see a menu button which will provide you with the option to Copy.
Delete Chart
If you find that one of the charts you have created is incorrect or no longer required you can delete it by hovering the mouse over its thumbnail in the Chart Thumbnail list at the bottom of the Charts step. You will now be able to see a menu button which will provide you with the option to Delete.
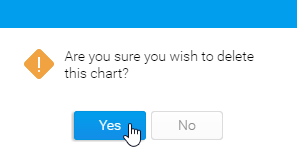
Once clicked, you will be prompted to confirm you wish to delete the chart.
Multi-Chart Use
Multi-Charts are displayed together through the use of the Canvas. This is set up on the Design step of the report builder.See Canvas for more information.
Multi-Chart Limitations
Available Functionality
The following interactive features are available:
- Series Selection
- Unit Selection
- Map Zoom
Unavailable Functionality
The following interactive features are unavailable:
- Time Slider
- Brushing


