Overview
Each Guided NLQ question must contain at least three elements — a time frame, the type of question, and what you want to ask about (see Ask a Question with Guided NLQ). The order is flexible, so you can start or end your question with the time period you’re interested in, for example. These different segments of a question are blocks as you use them to build your sentence.
Descriptive blocks
Show
Description: Use Show when you’re asking about metrics.
Example: I want to show the profit margin for each agency last year.
Use: Show Profit Margin (Sum) by Company Name For Last Year (Start Date)
List
Description: Use List when you’re asking about dimensions.
Example: I want to show the rating of all camps for last month.
Use: List Camp Names by Camp Rating (Average) For Last Month (Invoiced Date)
Count
Description: Use Count when you want to count unique values, such as products or customer names.
Example: I want to count how many camps there are in each region with no time constraints.
Use: Count Camp Names by Camp Region For All Time
Top
Description: Use Top when you’re looking for the highest ranked of something stored in your data.
Example: I want to find the 10 best-performing camps for profit margins for last year.
Use: Top 10 by value Camp Names by Profit Margin For Last Year (Start Date)
Bottom
Description: Use Bottom when you’re looking for the lowest ranked of something stored in your data.
Example: I want to find the five camps with the lowest profit margin for this year so far.
Use: Bottom 5 by value Camp Names by Profit Margin For This Year to Date (Start Date)
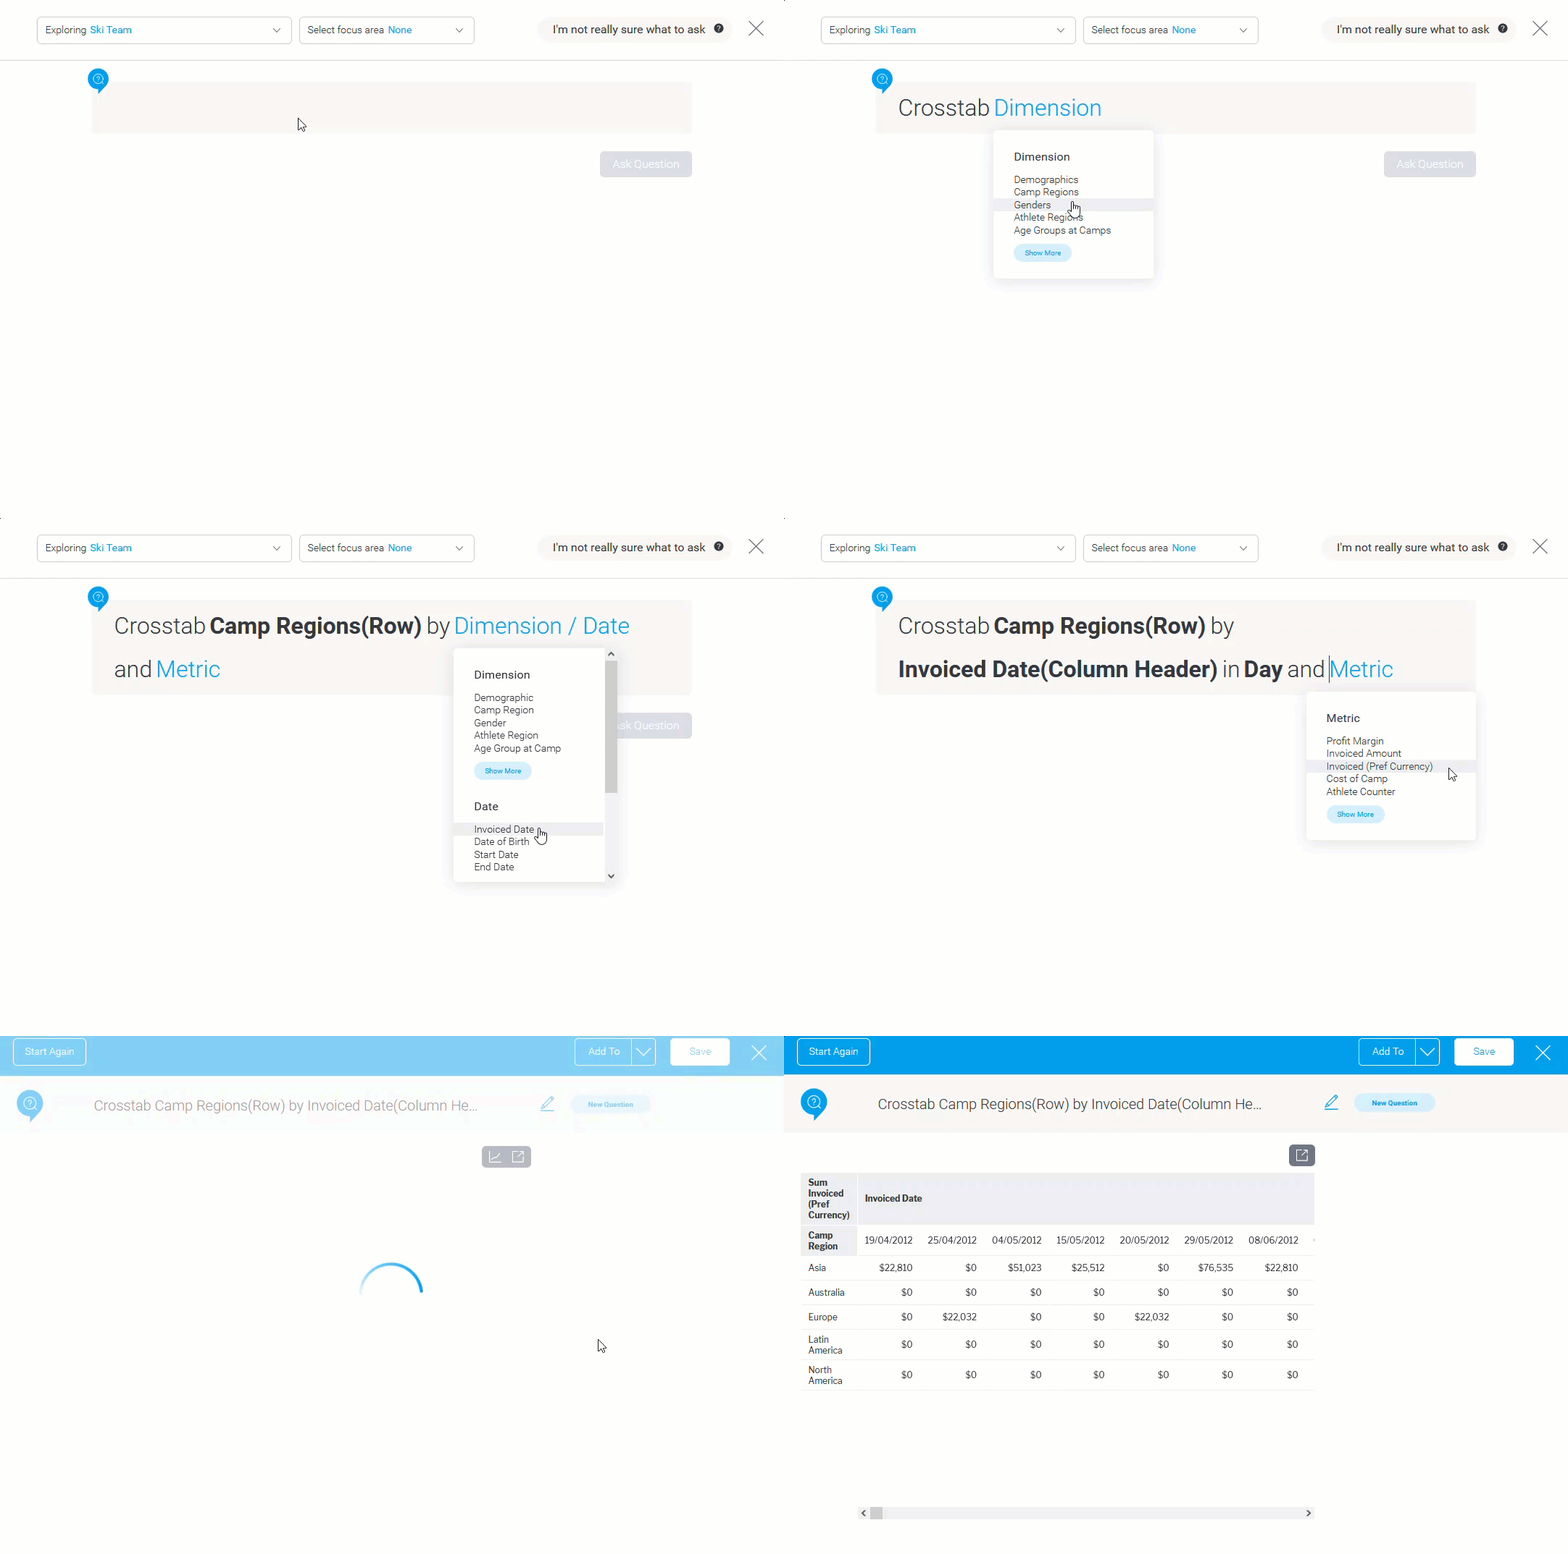
Crosstab
Description: Use Crosstab report to view metric data sliced by dimensions appearing in rows and columns.
Example: I want to view a metric such as Invoiced Amount, by Regions appearing in rows and Dates appearing as columns.
Use: Crosstab Camp Regions (Row) by Invoiced Date (Column Header) in Day and Invoiced Amount (Sum)
Variance blocks
Compare
Description: Use Compare when you’d like to understand the value of one set of information versus another set.
Example: I want to compare sales this year with sales last year.
Use: Compare Profit Margin (Sum) between Last Year (Start Date) and This Year to Date
Difference
Description: Use Difference when you’d like to see the gap between two sets of information.
Example: I want to see the difference between last year’s costs and this year’s costs.
Use: Difference Cost of Camp (Sum) between Last Year (Start Date) and This Year to Date
Variance
Description: Use Variance to calculate percentage difference between two sets of information.
Example: I want to see how much my costs have changed between this year and last year as a percentage.
Use: Variance in Cost of Camp (Sum) between Last Year (Start Date) and This Year to Date
Date periods
For
Description: Use For to select a date field from your data, a predefined time period (such as last quarter or today), a manually chosen date from the date picker, or a date you type manually (such as July 2020 or Jul 2021). The question’s results will include data only from the dates you’ve chosen.
Between
Description: Use Between to manually select a ‘from’ date and a ‘to’ date from the date picker. Your question’s results will include data from those two dates and the dates in between only.
Before
Description: Use Before if you want to display results before a certain date, via the date picker. Your question’s results will include data from the date you’ve chosen and any earlier dates only.
After
Description: Use After if you want to display results after a certain date, via the date picker. Your question’s results will include data from the date you’ve chosen and any later dates only.
More question elements
And
Description: Use And to select more than one field to include in your question.
Example: I want to see all agency invoices that were created last year.
Use: List Company Names and Invoiced Date (None) For Last Year (Invoiced Date)
By
Description: Use By to show your results broken down using another field or a date.
Example: I want to see the monthly cost of camps since they started.
Use: Show Cost of Camp (Sum) by Month (Start Date) For All Time
Highlight
Description: Use Highlight to draw attention to certain elements of your results, such as outliers, averages, trends, step changes and more. More than one highlight can be applied, and highlight options may change to suit your question’s content.
Example: I want to see which agencies have profits of more than $400,000 this year so far.
Use: Show Profit Margin (Sum) by Company Name highlight values greater than 400,000 For This Year To Date (Start Date)
With (More/Less/Both/No/Growth/Decline)
Description: Use With to construct complex questions to refine your results through comparisons. With is only available with certain question types, such as List and Count.
Example: I want to see which agencies produced higher profits in Europe than America .
Use: List Company Names with more Profit Margin (Average) in Camp Regions Europe than North America For Last Year (Invoiced Date)
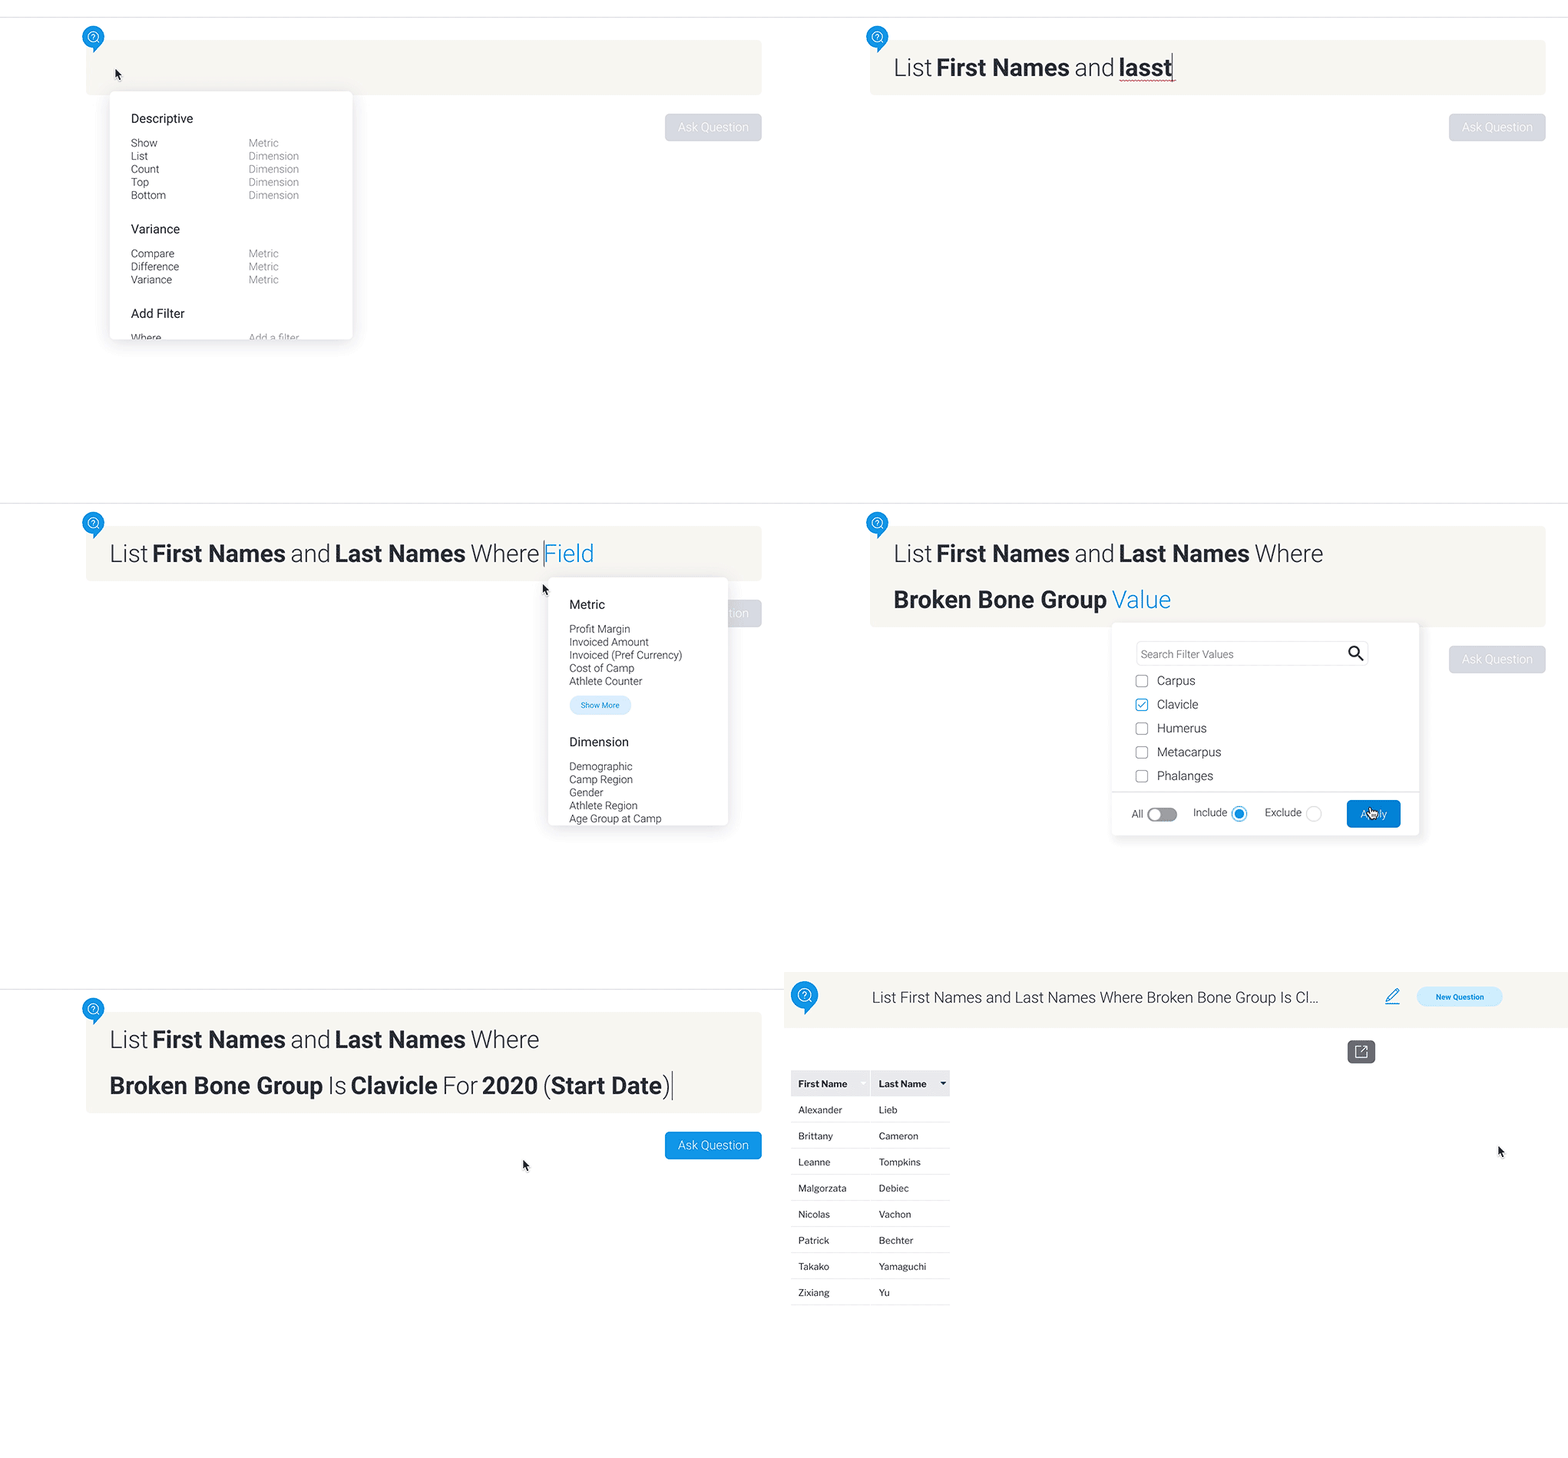
Where
Description: Use Where to refine your results by filtering out anything that isn’t relevant. You can also start your question with Where.
Example: I want to see who broke their clavicles at camps in 2020.
Use: List First Names and Last Names Where Broken Bone Group is Clavicle For 2020 (Start Date)
Calculations
When asking questions about metrics (number fields), you can make use of a number of calculations. Calculations can be performed with Show, Count (which counts a dimension field and outputs the result as a metric), Compare, Difference and Variance.
Calculation | Description |
Divided by (/) | Divide metric 1 by metric 2. |
Multiplied by (*) | Multiply metric 1 by metric 2. |
Minus (-) | Subtract metric 2 from metric 1. |
Plus (+) | Add metric 1 to metric 2. |
Useful tips
- Only two metric fields can be used with a calculation.
For example, m1 + m2, but not m1 + m2 + m3, and not m1 + 20. - Each metric may take its own aggregation.
For example, m1 (sum) + m2 (avg).
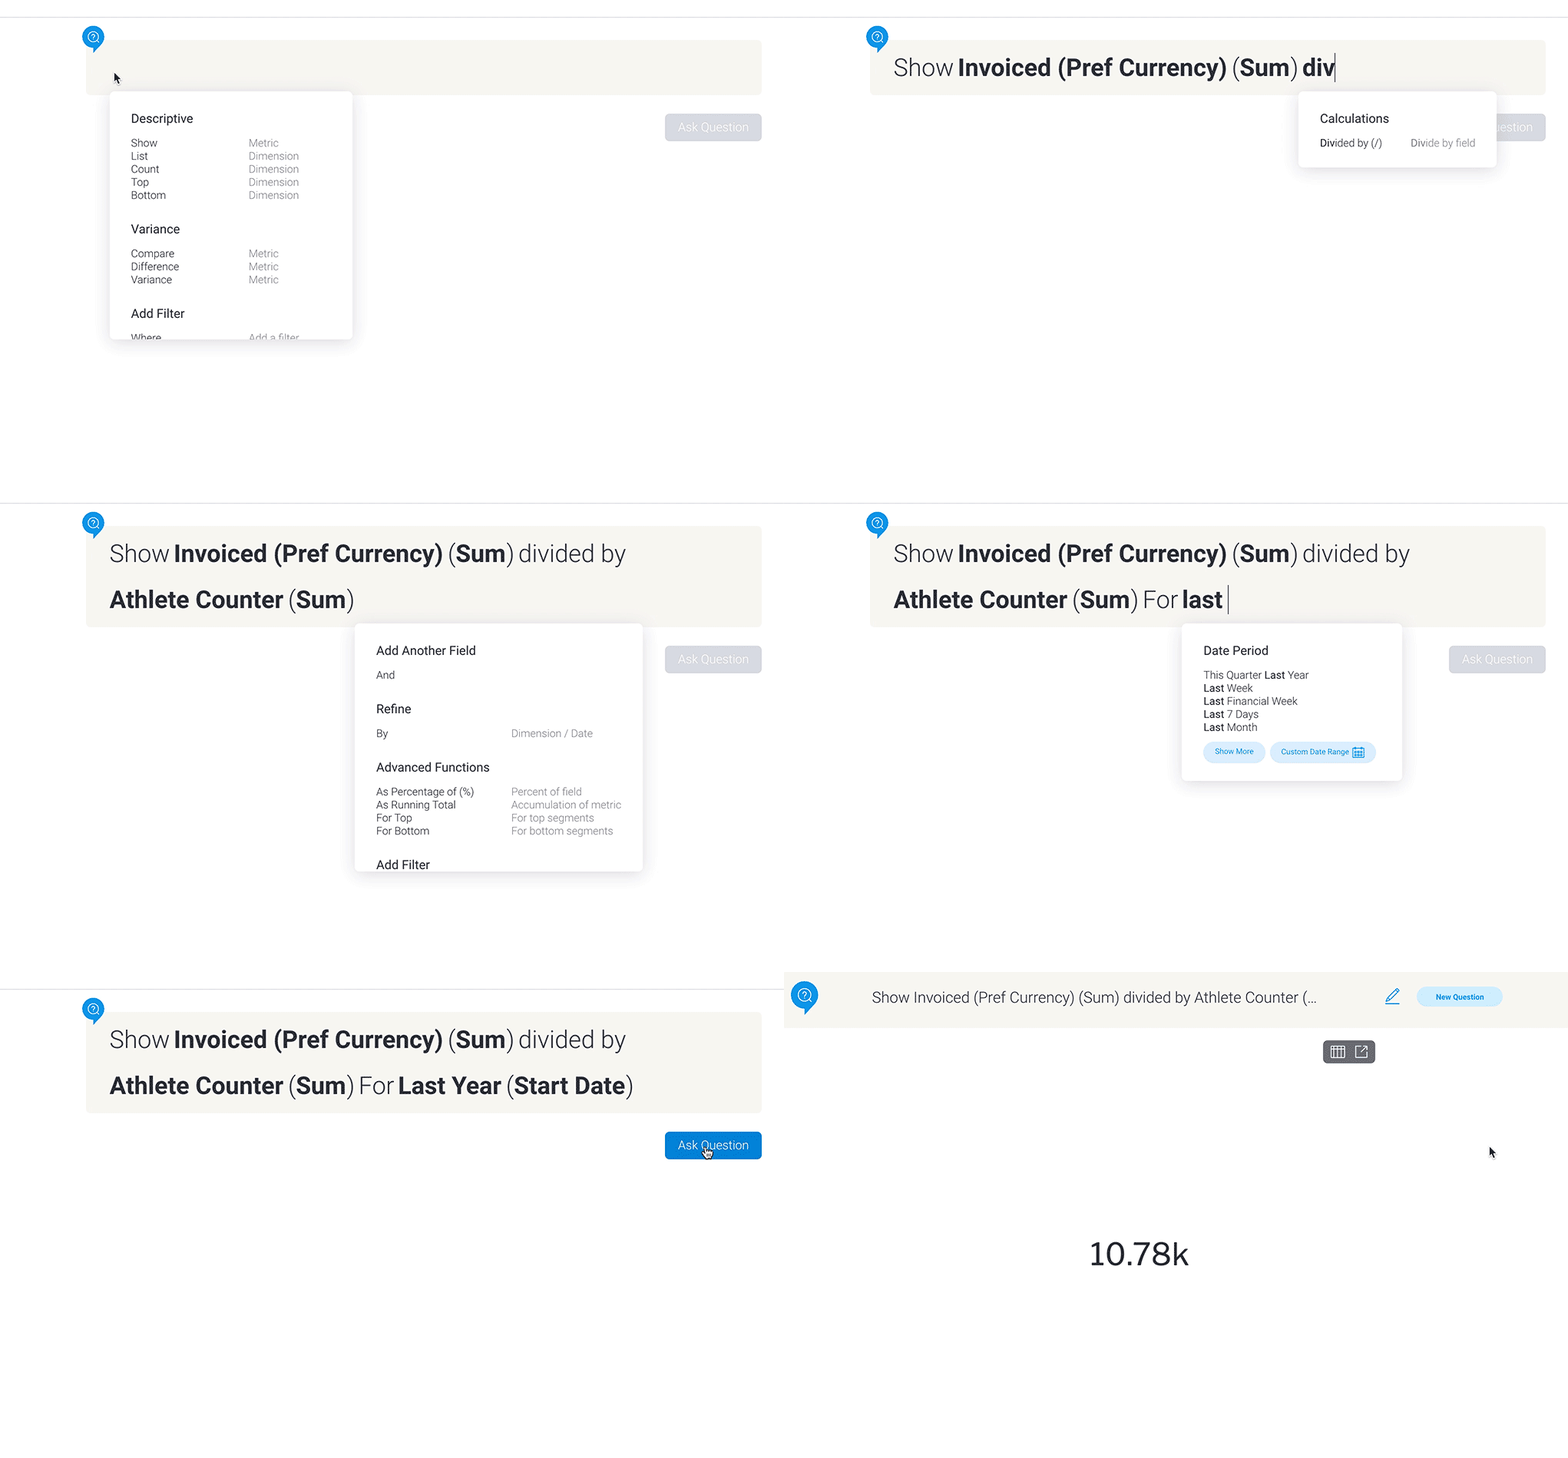
Description: Use calculations such as Divided by (/) when you want to perform arithmetic on the values in your question.
Example: I want to see the average revenue per athlete last year.
Use: Show Invoiced (Pref Currency) (Sum) divided by Athlete Counter (Sum) For Last Year (Start Date)
Advanced functions
Advanced functions are only available in mathematically logical situations. For example, it’s impossible to compare two metrics as a top 10. See the descriptions below for further information on how each advanced function works.
As Percentage of (%)
Description: Use As Percentage of (%) to calculate a metric as a percentage of either its total, its maximum value, or another metric field. Display the results by a dimension or date.
Example: I want to see the monthly invoiced totals for 2018, represented as percentages.
Use: Show Invoiced Amount (Sum) as percentage of total by Month (Invoiced Date) For 2018 (Invoiced Date)
As Running Total
Description: Use As Running Total to calculate a metric as a running total — either as an accumulative percentage or the total value. Display the results by a dimension or date.
Example: I want to see the running total of annual invoice amounts for all time.
Use: For All Time Show Invoiced Amount (Sum) as running total of value by Invoiced Date in Year
For Top
Description: Use For Top to output the top n (choose your number) — either by value ranking or percentage — of a dimension or a date, using the metric value to order the output. This block can be used with Show and Count. When output as a percentage, this function may display additional amounts, depending on the percentages of the data returned. For example, a question asking to show the top 1% of something could display more than 1% simply because the top 1% is the same as the top 3% Similarly, if the top 10% produces three results, accounting for 6%, 3% and 4%, it will display the top 13% (all three results) rather than the top 9% (only two results).
Example: I want to see the top three highest performing demographics according to the invoiced amount for all time.
Use: For All Time Show Invoiced Amount (Sum) for top 3 by value Demographic
For Bottom
Description: Use For Bottom to output the bottom n (choose your number) — either by ranking or percentage — of a dimension or a date, using the metric value to order the output. This block can be used with Show and Count. When output as a percentage, This function may display additional amounts, depending on the percentages of the data returned. For example, a question asking to show 50% of something would display a result of 53% if the final row is at 49% and carries 4% weight.
Example: I want to display the bottom 10% of camps with the lowest profit margin in 2020.
Use: For 2020 Show Profit Margin (Sum) for bottom 10 percent of Camp Name by Camp Name
Operators
Questions with filters can use operators to reduce the final results. Operators can help to pinpoint certain results or exclude particular values. Available operators include:
- Between
- Different from
- Equal to
- Greater than
- Greater than or equal to
- In list
- Is not null (is not empty)
- Is null (is empty)
- Less than
- Less than or equal to
- Not between
- Not in list
Description: Use operators to refine the results of your question even further and will only be displayed when suitable for the question being asked.
Example: I want to see a list of last year’s camps where the average age was under 22.
Use: List Camp Names where Age at Camp (Average) Less than 22 For Last Year (Start Date)


