Overview
Guided NLQ is an excellent launchpad for meaningful answers to your questions. A chart or a table displayed as your answer can be further manipulated to suit your needs. For example, you can use your answer to create a new report (as long as you have access to create reports), saving you time in setting up a report manually. You can also toggle between chart and report with the click of a button, and insert your answer into dashboards, stories and presentations.
Switch between report and chart
Your Guided NLQ answer will be displayed as a chart or a table, depending on the size and nature of the results. If your answer returns too many results to display a chart, you won’t be able to toggle between table and chart. See our hints and tips page for details on this.
In most circumstances, you can switch between the chart and table of your answer with a single click.
Before starting the steps below, make sure you’ve asked a valid question. If you’re not sure how to ask a question, read about how to ask a question here.
- Ensure you’re looking at the answer to a question you’ve asked in Guided NLQ (we’ve used Ski Team data to produce an answer to the question: For Last Year (Start Date) Show Profit Margin (Sum) by Company Name
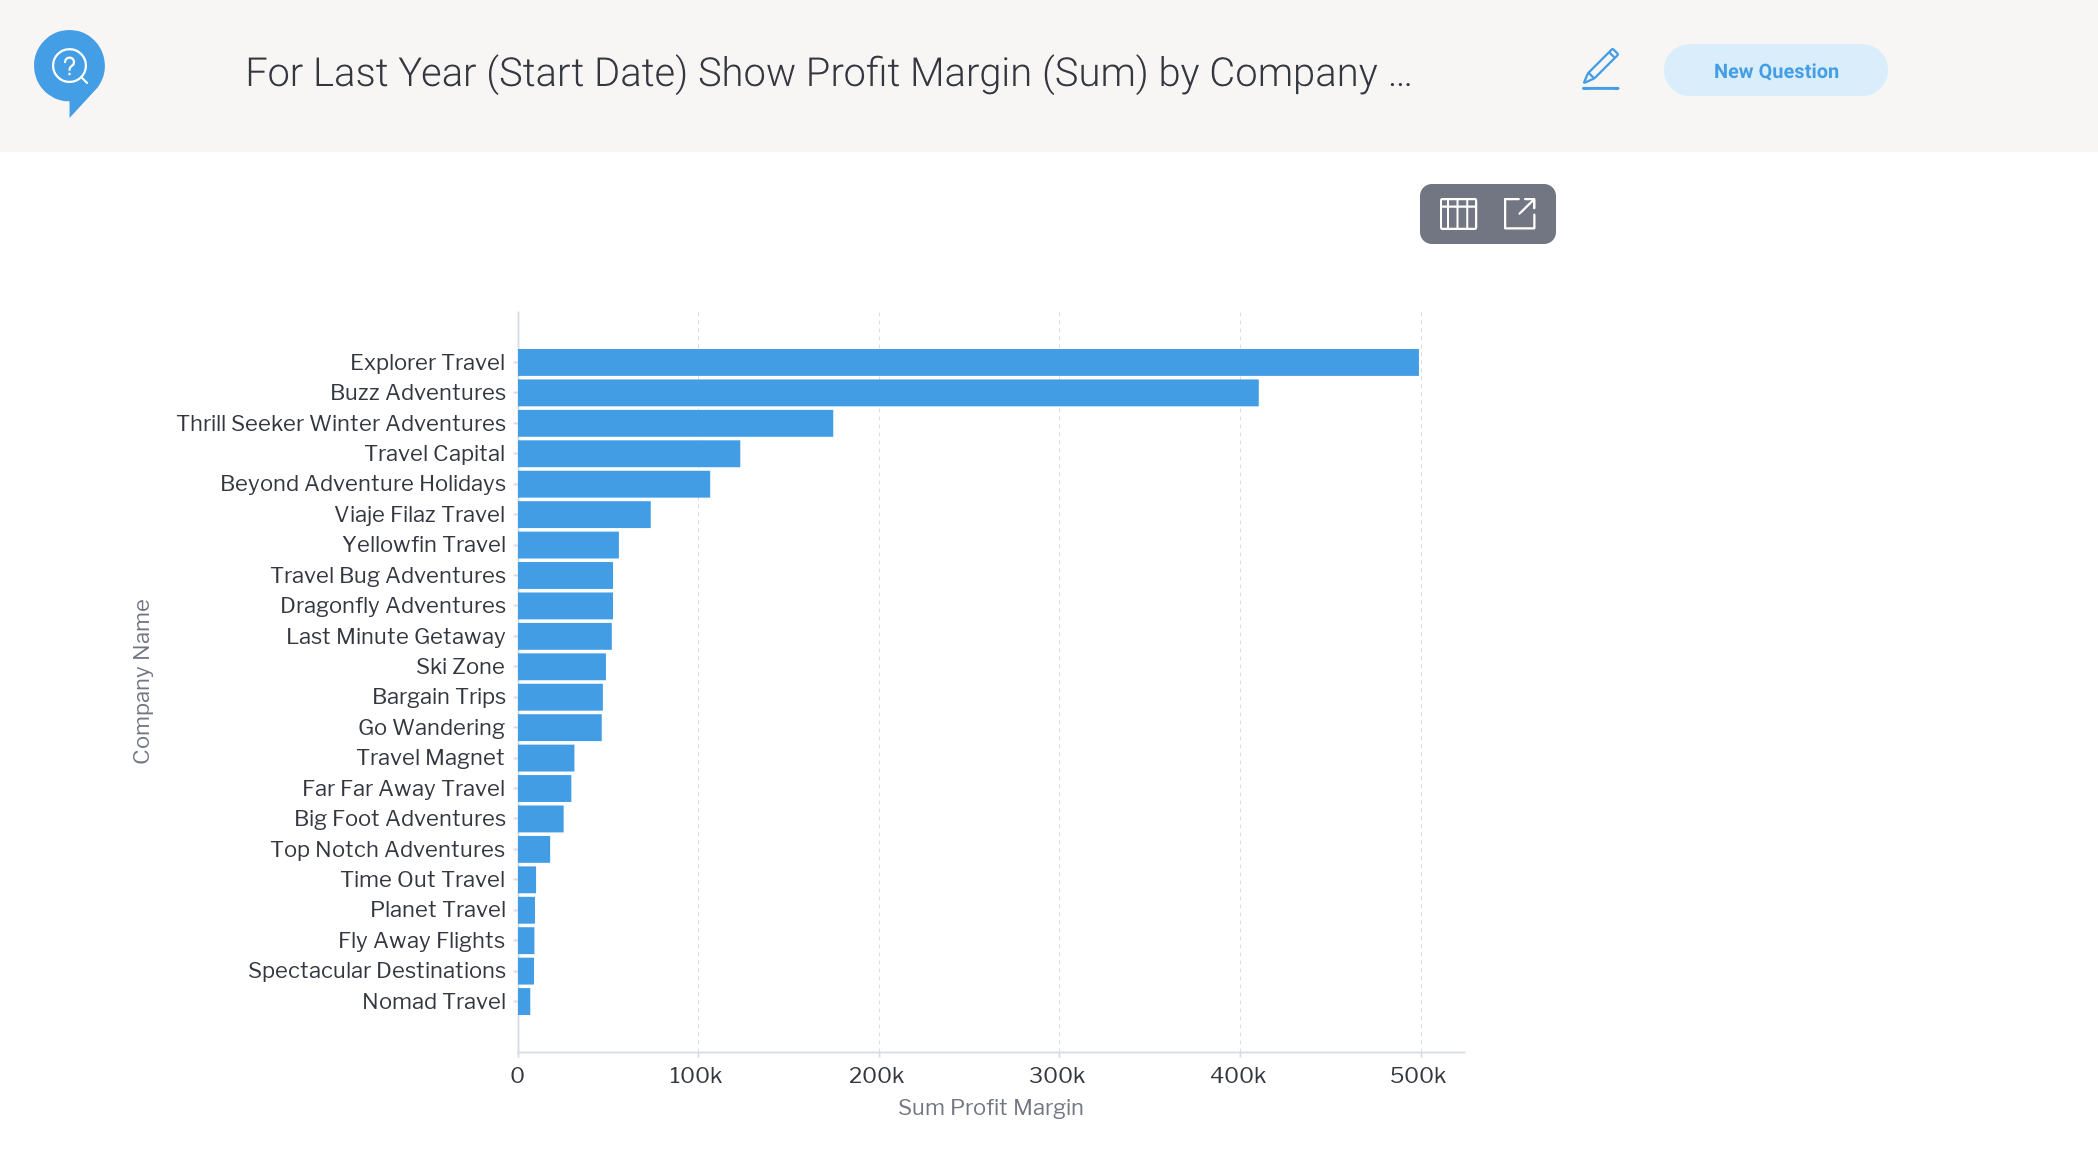
If you don’t see both tools on the grey toolbar above your answer, your answer is being displayed as a table as it has too many results to display as a chart, and this option to toggle to a chart won’t be visible: try asking a question that returns less results - If you’re looking at a chart, look for the gray toolbar above it and click the Table tool
 to toggle to the table
 - If you’re looking at a table, look for the gray toolbar above it and click on the Chart tool
 to toggle to the chart
 - Repeat steps 2 and 3 if you wish to keep toggling
Save your answer as a report
You can save your Guided NLQ answer as a report. After asking your question, Guided NLQ provides the option to save your answer as a report, if you have the right level of access.
Before starting the steps below, make sure you’ve asked a valid question. If you’re not sure how to ask a question, read about how to ask a simple question here.
- Ensure you’re looking at the answer to a question you’ve asked in Guided NLQ (we’ve used Ski Team data to produce an answer to the question: For Last Year (Start Date) Show Profit Margin (Sum) by Company Name)
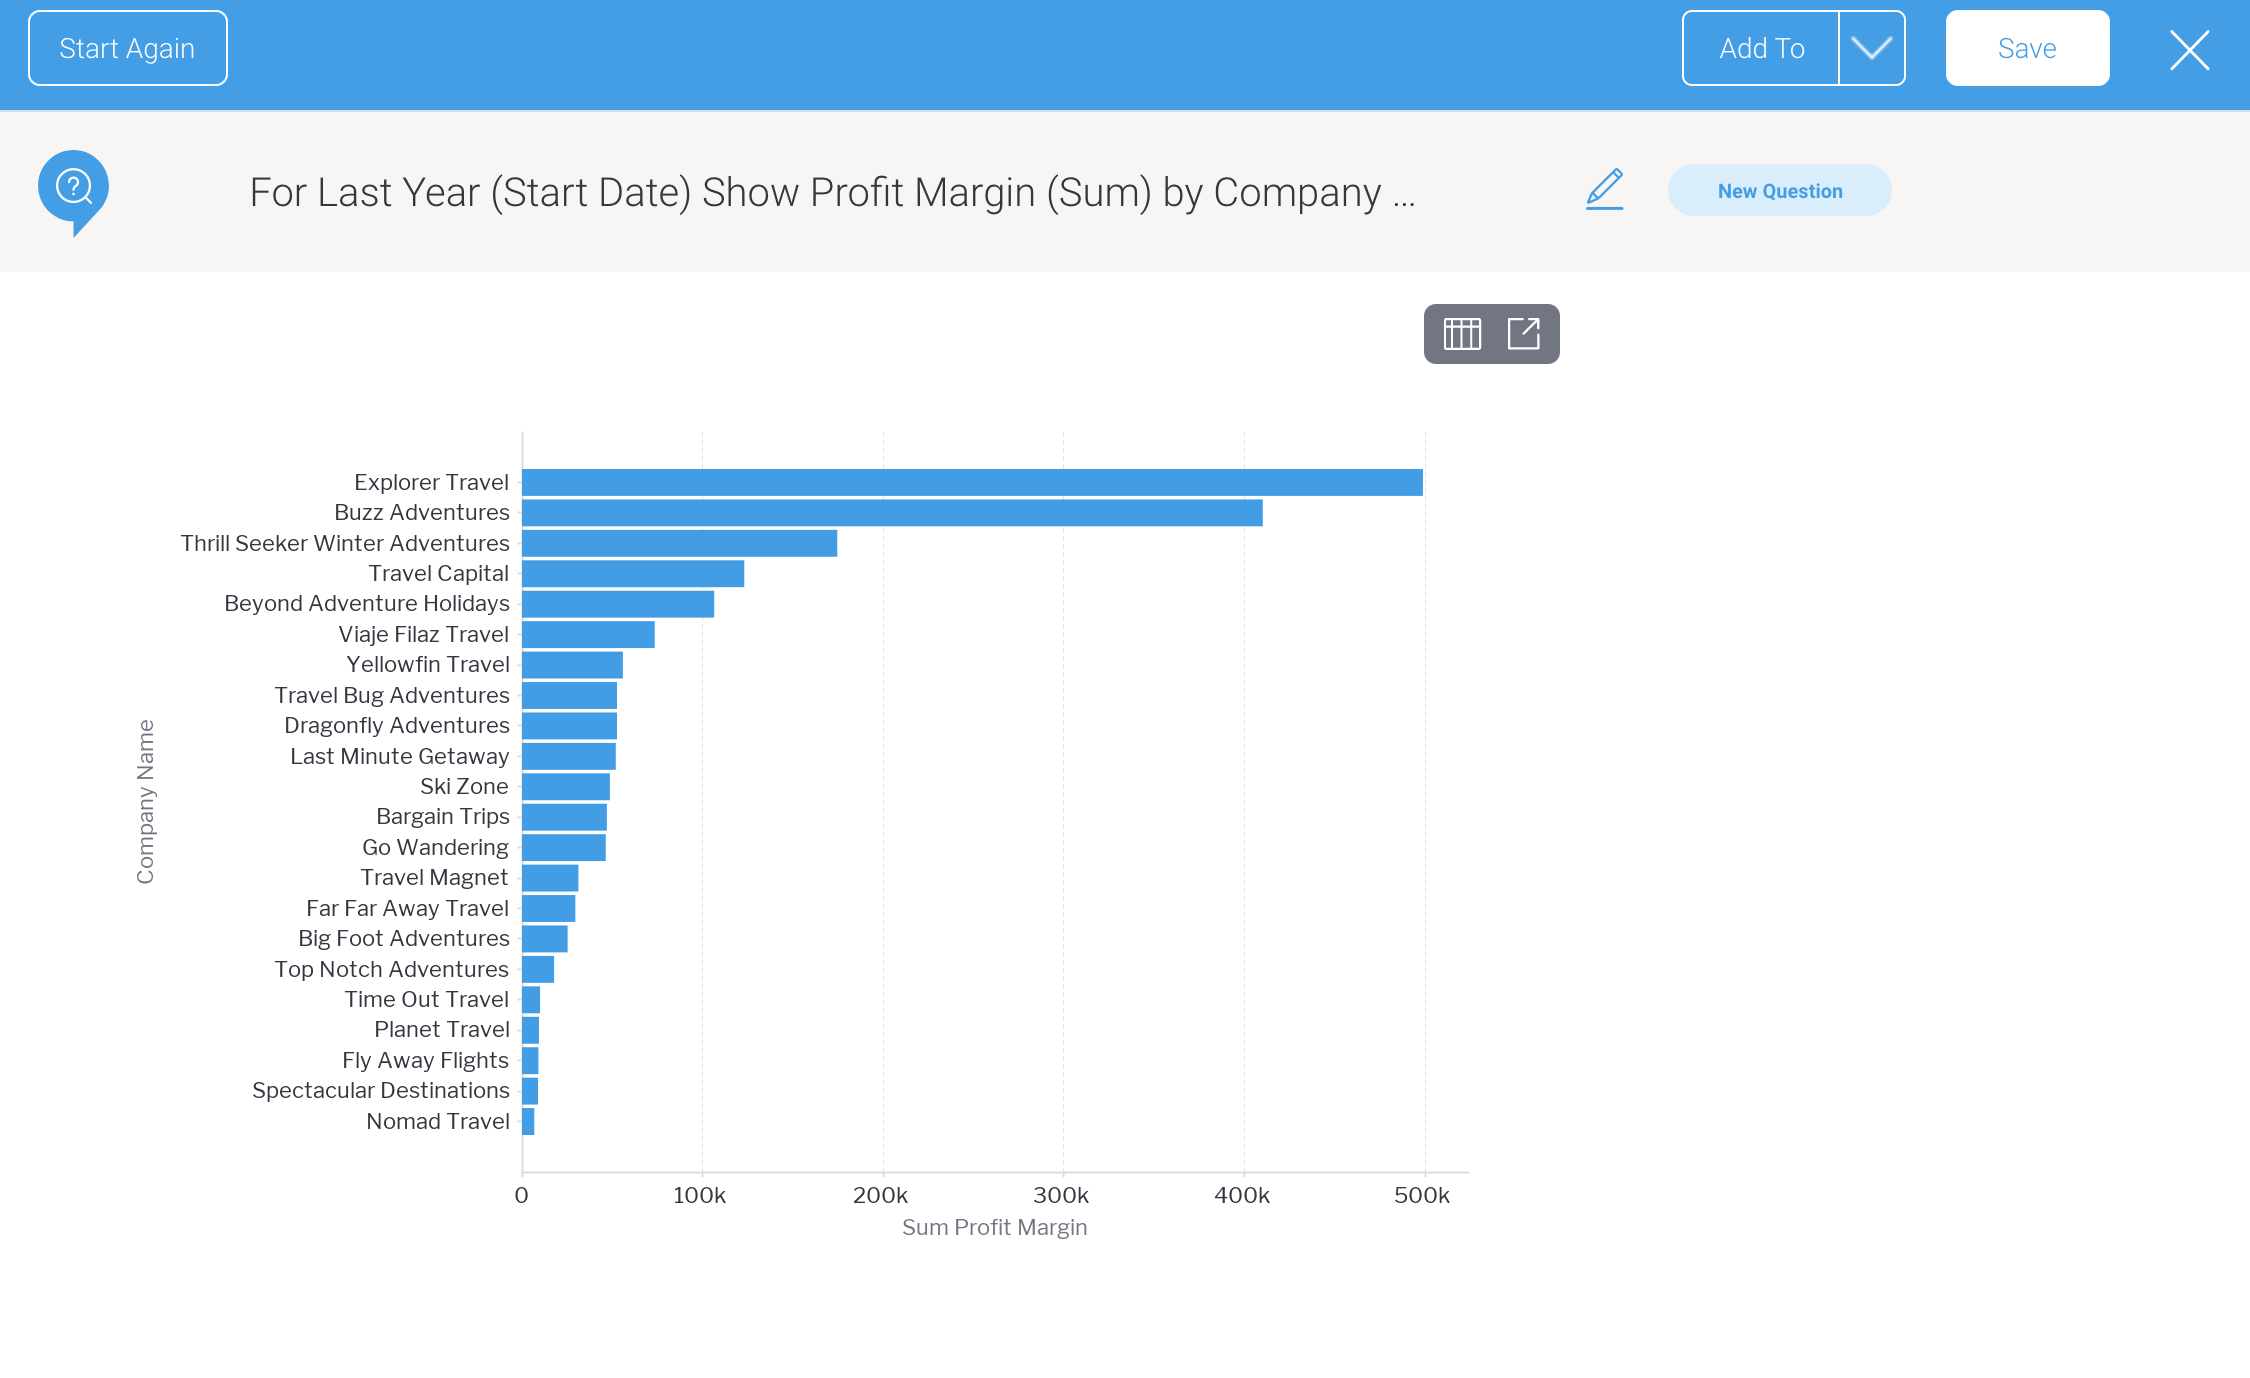
- Click the Save button in the top right corner of the window
The Save as Report dialog box will appear, prompting you to provide a name for your draft report, along with other information
- Triple-click on the field text Draft Report to select all all the text, and type a suitable name for your report
- If you wish to change the report description from the question you asked in NLQ, triple-click on the question text and type a suitable description

- If you wish to change the folder and sub-folder where the report will be saved, click on each of the dropdown menus to select a new location
- If you would like more details on the other options, see the wiki page on saving a report, then make any changes necessary
- Click the Save button to save your report and return to Guided NLQ
Open your answer as a report
You can create reports directly from Guided NLQ. After asking your question, Guided NLQ provides the option to open your answer in the Yellowfin Report Builder, as long as you have the right level of access.
Before starting the steps below, make sure you’ve asked a valid question. If you’re not sure how to ask a question, read about how to ask a question here.
- Ensure you’re looking at the answer to a question you’ve asked in Guided NLQ (we’ve used Ski Team data to produce an answer to the question: For Last Year (Start Date) Show Profit Margin (Sum) by Company Name)
- Look for the gray toolbar above it and click the Open Report tool

A dialog box may appear to confirm you wish to leave Guided NLQ (if you have multi-tab enabled, this message won’t appear and you will see your report in a new browser tab)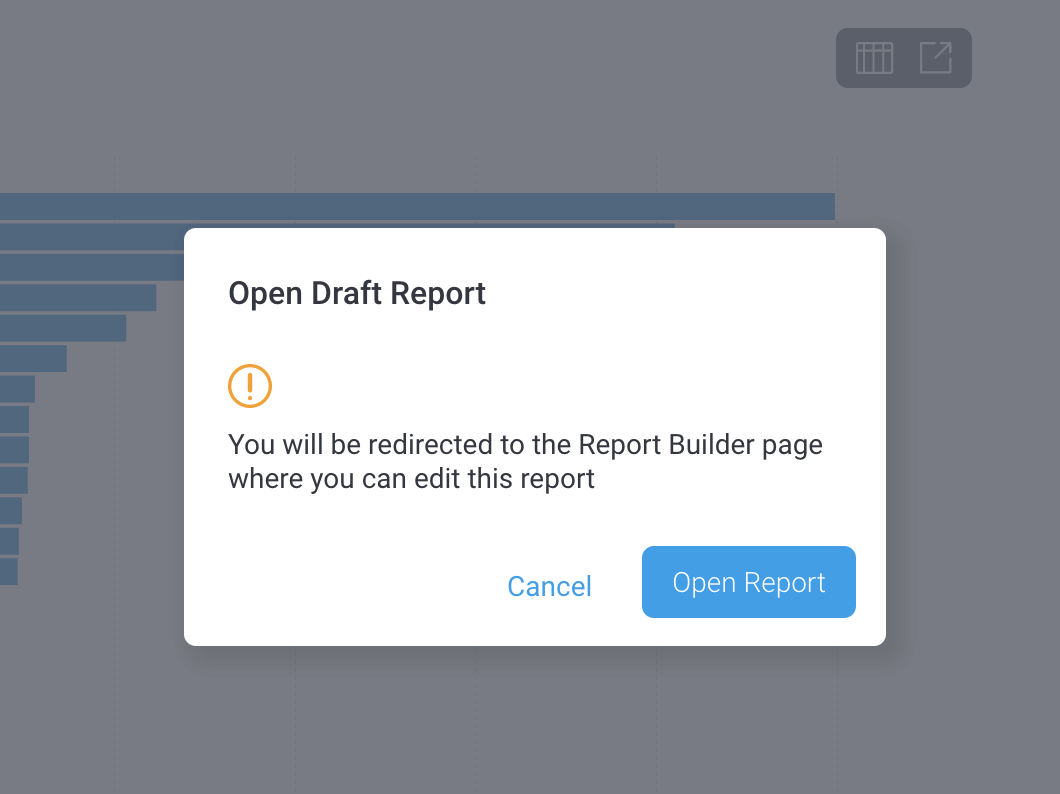
- If the dialog box appears, click the Open Report button
Your report will open in draft mode in the Report Builder, ready for you to edit and publish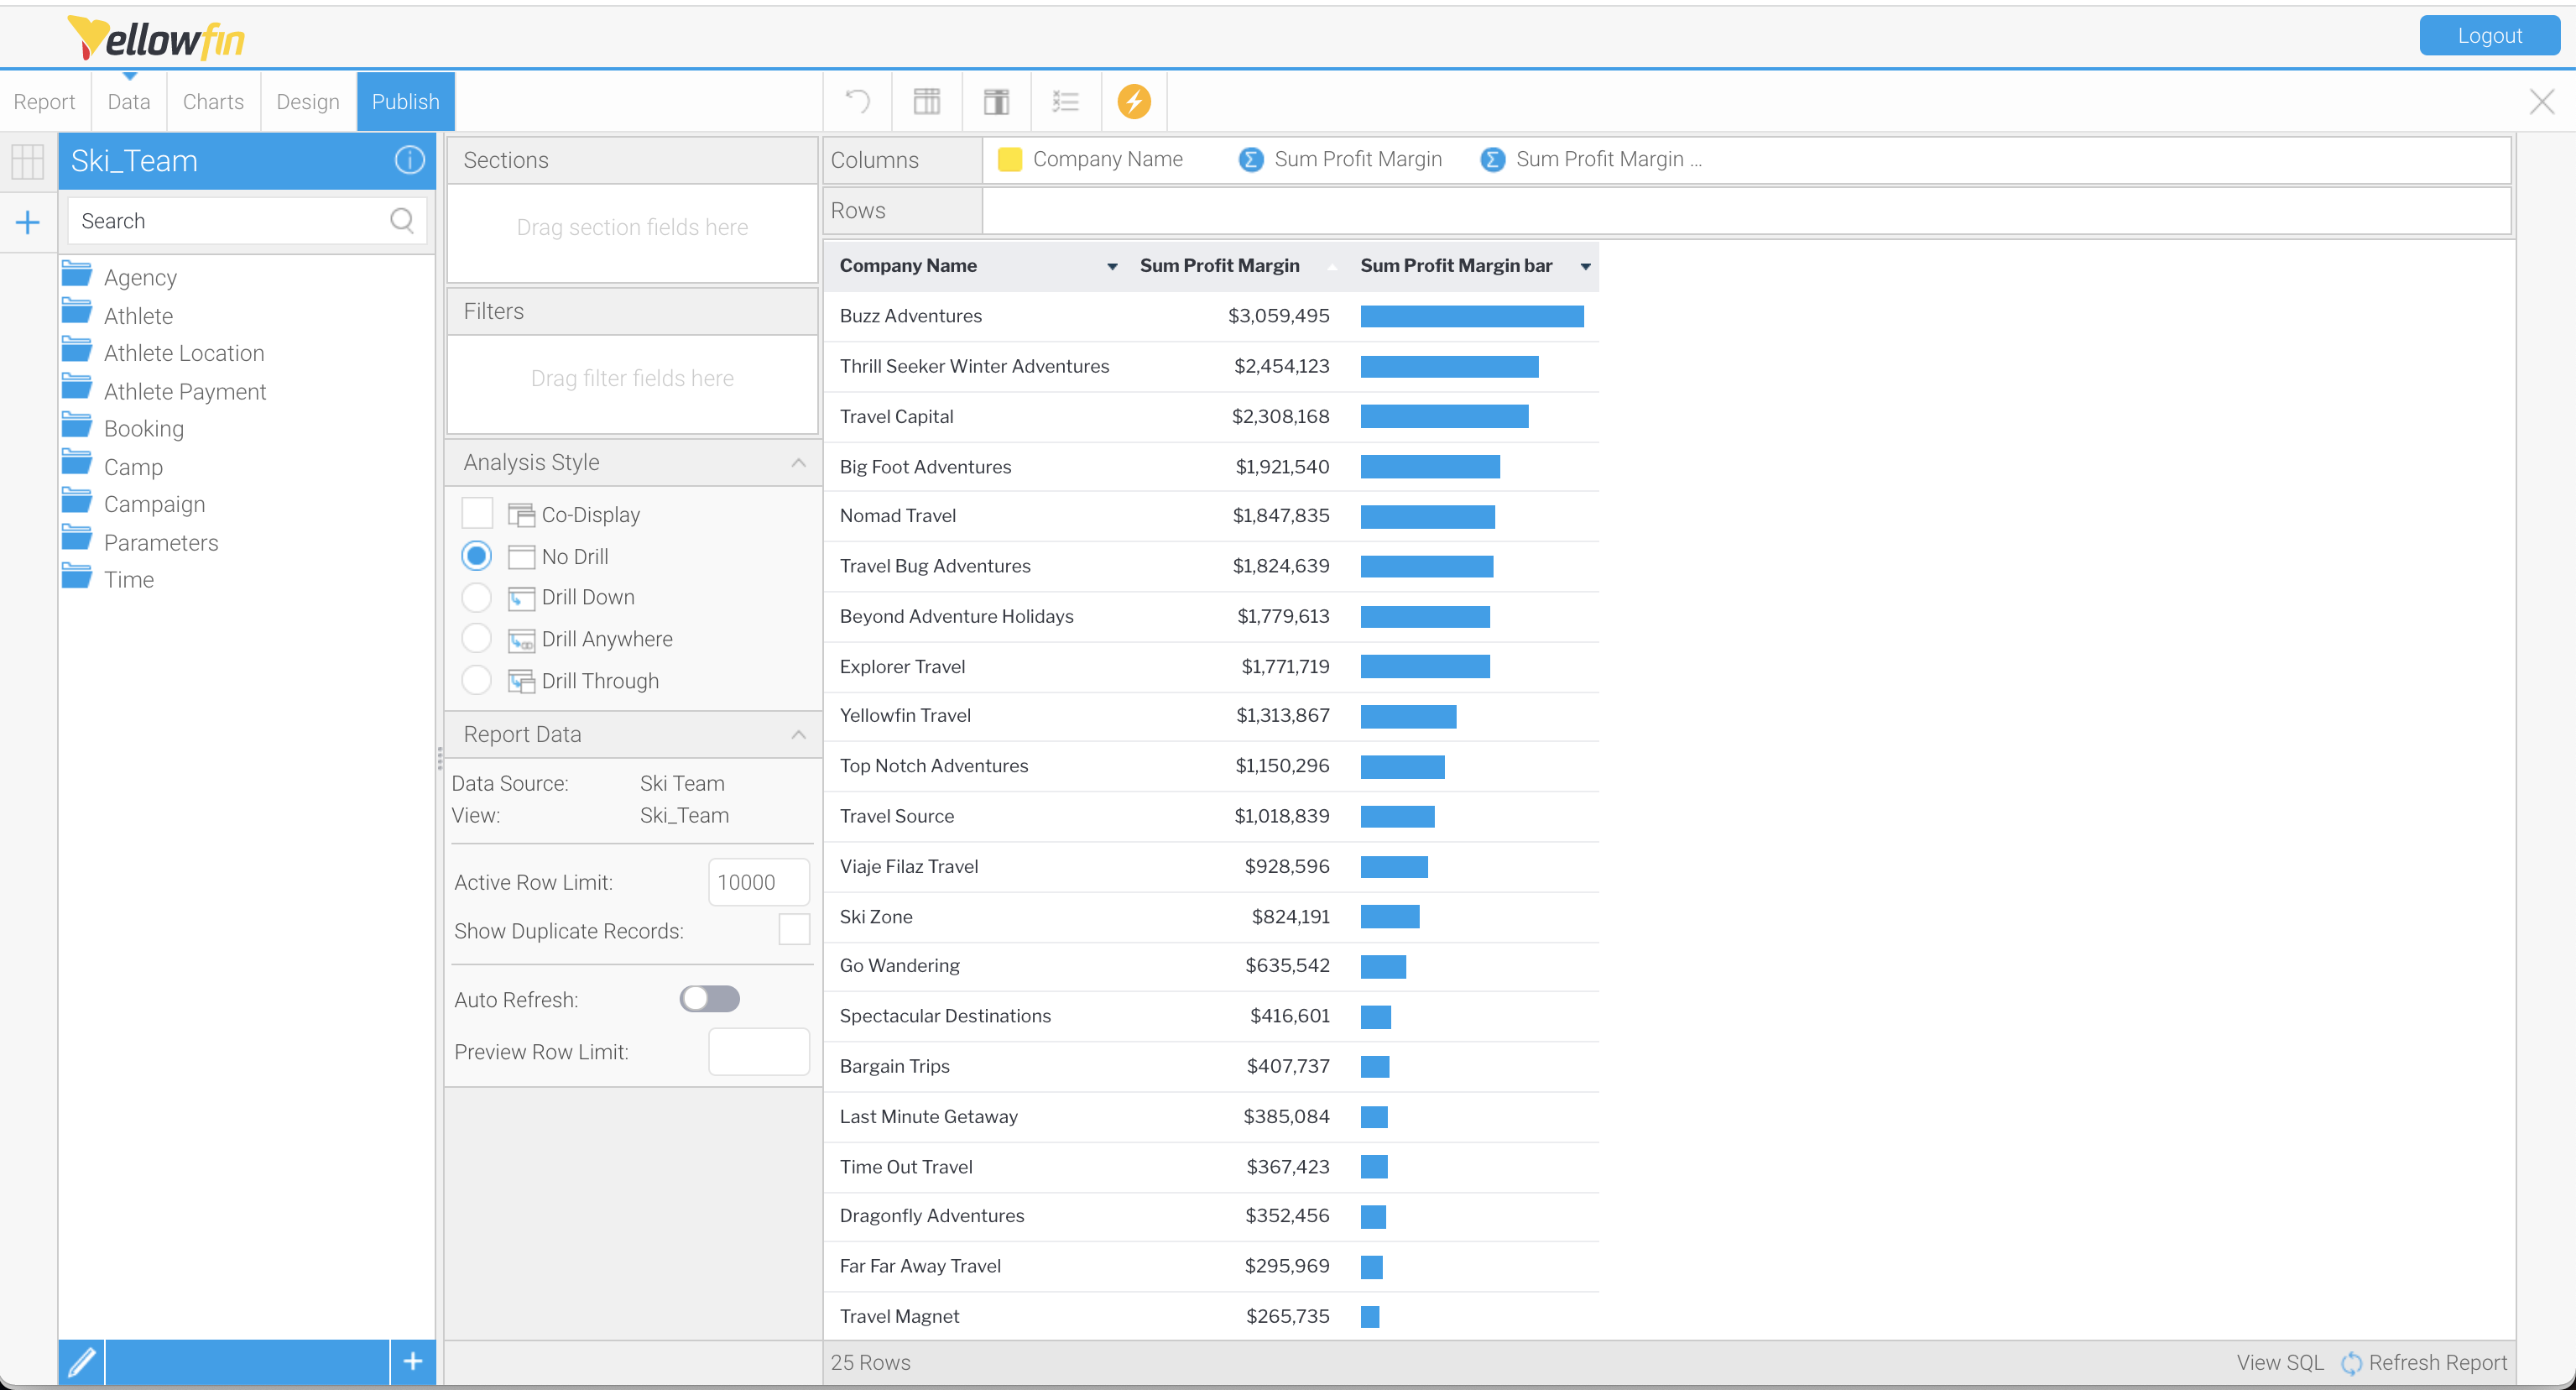
- For more information on building reports, take a look at our data discovery section