Page History
...
A View is a translation layer used by Yellowfin to hide the complexity of database structures from Report writers. The View is used to define which columns in your database you wish to make available for building Reports. These fields may come from multiple tables and therefore will require joins (the business logic that links rows in different tables together).
Additional Learning: See more information on Views.
Before you can create Reports, Charts, or Dashboards, you need to build a View. Follow the instructions in this section to learn how to create and configure a View.
Note: If you are not already on the Browse page, please navigate there. (Burger Bun -> Browse All)
Create a Multiple Table View:
- Click Create and select “View”.
Note: If you don’t see the Create button in the top right corner, open the Burger Bun. You’ll see a yellow Create option. Open and select “View”. - Select “Ski Team” as your Data Source.
Note: For this exercise we will be using the pre-installed tutorial data source, “Ski Team”. After creating Reports and Dashboards using the Ski Team data source, you’ll be guided on how to connect your own data source and build content using your own data. - Select “Multiple Tables” as your View Type. Select Create Viewto enter the Model step.
Additional Learning: You also have the option to create a View from a single table from your database. If the Single Table option is selected, you will be prompted to select the desired table, and Yellowfin will skip the View Builder and take you straight to a draft Report. Additionally, advanced users have the option of using Freehand SQL.
Creating the Model:
In the Model step, you will drag in the desired tables onto the model canvas, join the tables, and select columns to be available for Reporting and analysis.
...
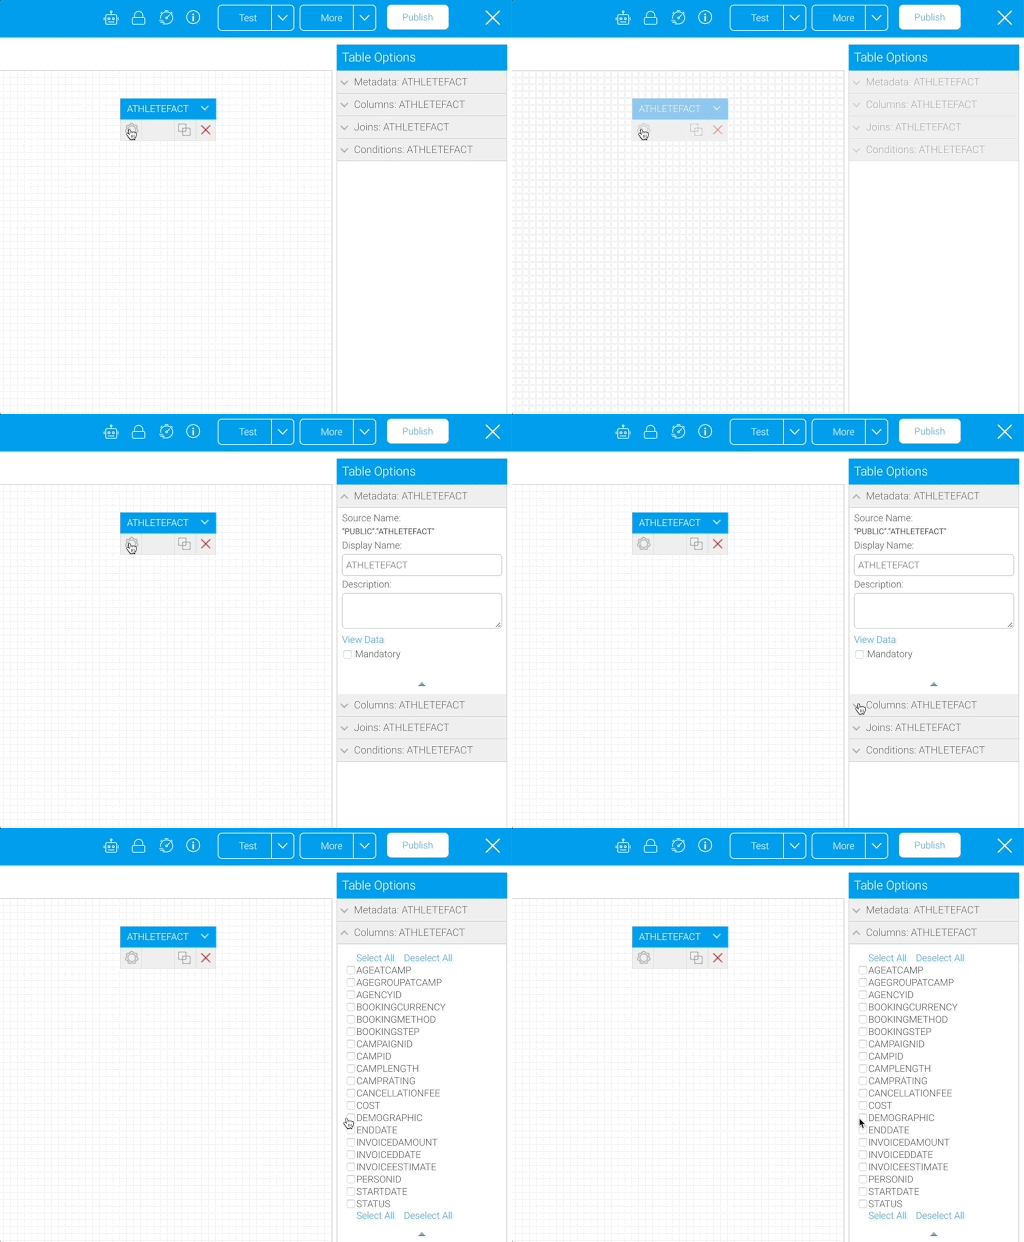
- Drag in the “ATHLETEFACT” table.
This table has information about athletes who have participated in ski camps. - Select the gear at the bottom of the table. In the Table Options on the right hand side, expand the Columns section.
- Select “CAMPRATING”, “DEMOGRAPHIC”, “ENDDATE”, “INVOICEDAMOUNT”, and “STARTDATE” from the list in the Columns tab. Click the gear at the bottom of the table again to update the settings. The columns you selected will now appear in bold.
Note: The selected fields will be visible as your columns when creating Reports. The unselected fields will not appear or be available to build content.
Add “CAMP” Table:
- Drag in the “CAMP” table.
You’ll use this table to extract information on the regions and demographics of the ski camps.
- Select the gear on the “CAMP” table.
- Select “CAMPDEMOGRAPHIC”, “CAMPDESCRIPTION”, and “CAMPREGION” as your columns. Click the gear again to update the settings.
Next, join the two tables together.
Join the “ATHLETEFACT” table with the “CAMP” table:
- On the “ATHLETEFACT” table, click the join icon. This will pop up a window to set up your join.
Note: The Join From needs to be the “ATHLETEFACT” table. If your Join From is the “CAMP” table, click Delete Join, and make sure to select the join icon from the “ATHLETEFACT” table.
- Select “Inner Join” as the Join Type, and “One to One” as the Cardinality. In the Join To drop down menu, select “CAMP”.
Additional Learning: Learn about different join types.
- From the “ATHLETEFACT” table, select the “CAMPID” column to be used to join the tables together. Set the operator to “Equal to” and from the “CAMP” table, select the “CAMPID” column. Click Add, then click Save & Close at the top right corner.
You should now see your model, with the two tables joined together using an inner join.
...
Note: Hovering over the join icon will display the logic in a tooltip.
Repeat this process for the “DATELOOKUP” table.
Add “DATELOOKUP” table:
- Drag in the “DATELOOKUP” table.
This table has one row per date. In the next steps, you will extract a few date fields of different granularities. These will be especially useful in building Time Series Charts later on.
...
- Select the join icon on the “ATHLETEFACT” table.
- Select “Inner Join” as the Join Type, and “One to One” as the Cardinality. In the Join To drop down menu, select “DATELOOKUP”.
Note: Again, the Join From needs to be the “ATHLETEFACT” table. - From the “ATHLETEFACT” table, select the “INVOICEDDATE” column to join the tables together. Set the operator to “Equal to” and from the “DATELOOKUP” table, select the “DAYDATE” column. Click Add, then click Save & Close at the top right corner.
Note: You can move the tables around as needed to make the diagrams easier to read as you add and join more tables.
Add “PERSON” table:
- Drag in the “PERSON” table.
This table has information about the people who have participated in ski camps. Add this table to analyse information on participant gender and location. - Select the table’s gear .
- Select “GENDER”, “ISOCODE, and “REGION” as the columns. Click the gear on the “PERSON” table to save the changes.
Note: Both the “ISOCODE” and “REGION” indicate a person’s location, just at different granular levels. You will map the iso codes to a list of countries later on.
...
- Change the Display Name of “CAMPDESCRIPTION” to “Camp Name”.
Note: See more information on field settings.
Reference Codes:
Reference Codes allow for more meaningful values in Reports with numeric- and text-based data by mapping a code to a descriptive value. For example, a text field that contains 'Y' or 'N' could be mapped to display 'Yes' or 'No'.
...
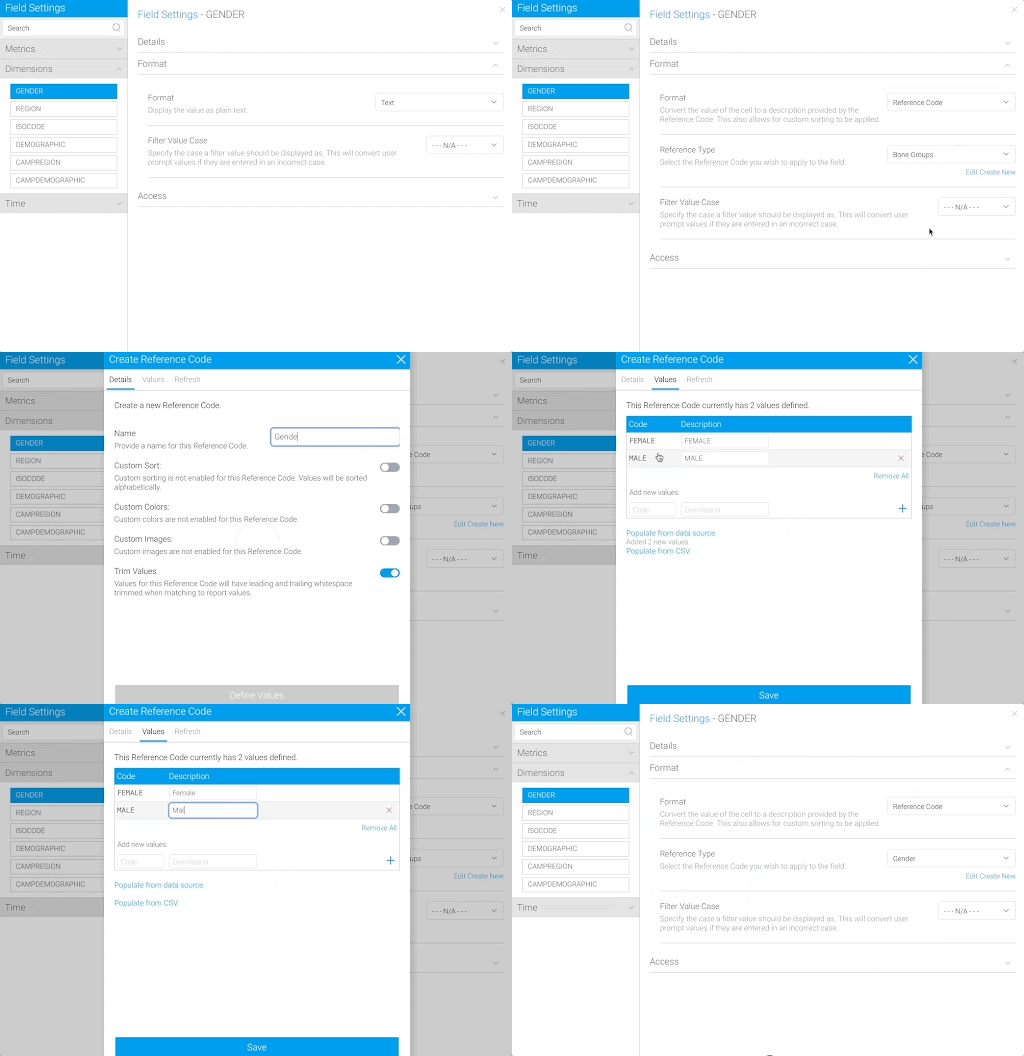
- Change the Display Name of “GENDER” to “Gender”.
- Change the Format to “Reference Code”.
- Select “Create New”.
- Name the Reference Code “Gender” and move to the Values tab.
- Click Populate from data source and change the descriptions to “Male” and “Female”. Click Save.
For the “Demographic” field, you will use an already existing Reference Code instead of creating your own.
Demographic:
- Change the Display Name of “DEMOGRAPHIC” to “Demographic”.
- Change the Format to “Reference Code”.
- Select “Demographic” as the Reference Type.
Note: This Reference Code has a custom sort order, custom colors, and custom images. When building a Report using the “Demographic” field, the data is sorted by this custom order. The custom colors and images can be utilized in Charts and filters to ensure values are easily identified and consistent across Reports.
...


