Page History
...
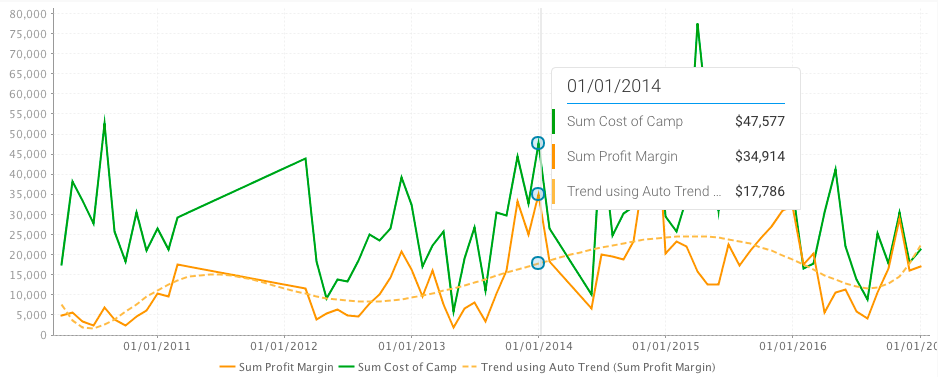
Tooltips are a great way of finding out values of data points. Hovering the cursor over a chart point will reveal the tooltip to reveal exact values and interact with the data.
| Section | ||||||||||
|---|---|---|---|---|---|---|---|---|---|---|
|
| Section | ||||||||||
|---|---|---|---|---|---|---|---|---|---|---|
|

Colour-coded Multiple Values
...
...
Tooltips are a great way of finding out values of data points. Hovering the cursor over a chart point will reveal the tooltip to reveal exact values and interact with the data.
| Section | ||||||||||
|---|---|---|---|---|---|---|---|---|---|---|
|
| Section | ||||||||||
|---|---|---|---|---|---|---|---|---|---|---|
|
...