Page History
| Anchor | ||||
|---|---|---|---|---|
|
| Table of Contents | ||
|---|---|---|
|
...
| Section | ||||||||||
|---|---|---|---|---|---|---|---|---|---|---|
|
| Styleclass | ||
|---|---|---|
| ||
Tooltip Functions
This section contains various processes on the interactivity of the tooltip. Functions that you can perform include: filtering, data drilling, and auto analysis.
...
Click on a link below to view the its procedure:
| Expand | ||
|---|---|---|
| ||
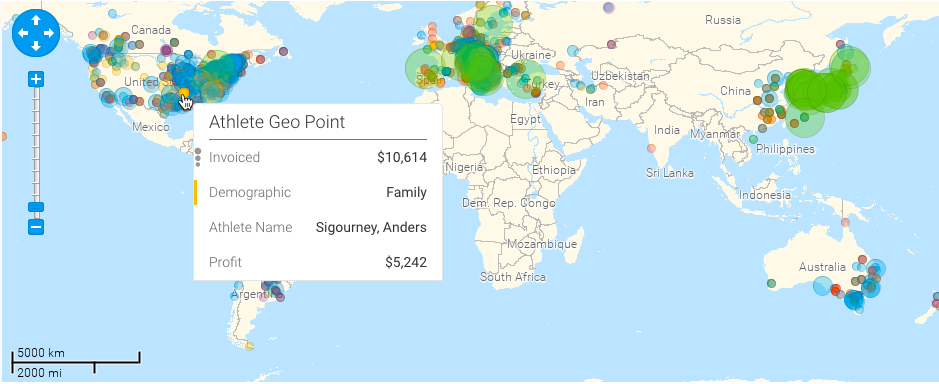
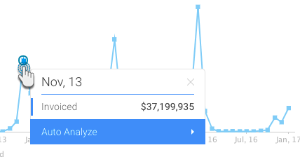
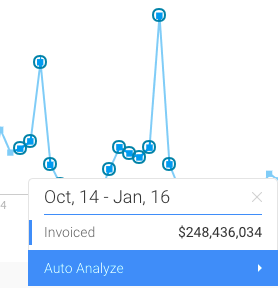
You can view the exact value of a data point, or multiple data points using the tooltip. On making the tooltip appear, you will be able to also view any functions that can be performed.
|
...
| Expand | ||
|---|---|---|
| ||
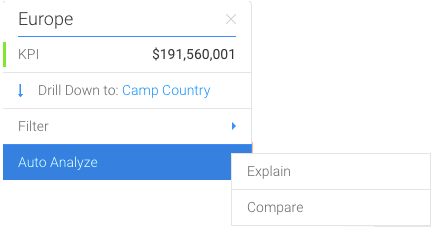
The Auto Analyze option in the tooltip is used to find out the Instant Insights on your chart. Learn how to do that here.
|
| Styleclass | ||
|---|---|---|
| ||