Page History
...
- Navigate to the dashboard you are interested in.
- Locate the chart that you want to analyse (perhaps there is a large difference between two elements on a chart that you are interested in exploring).
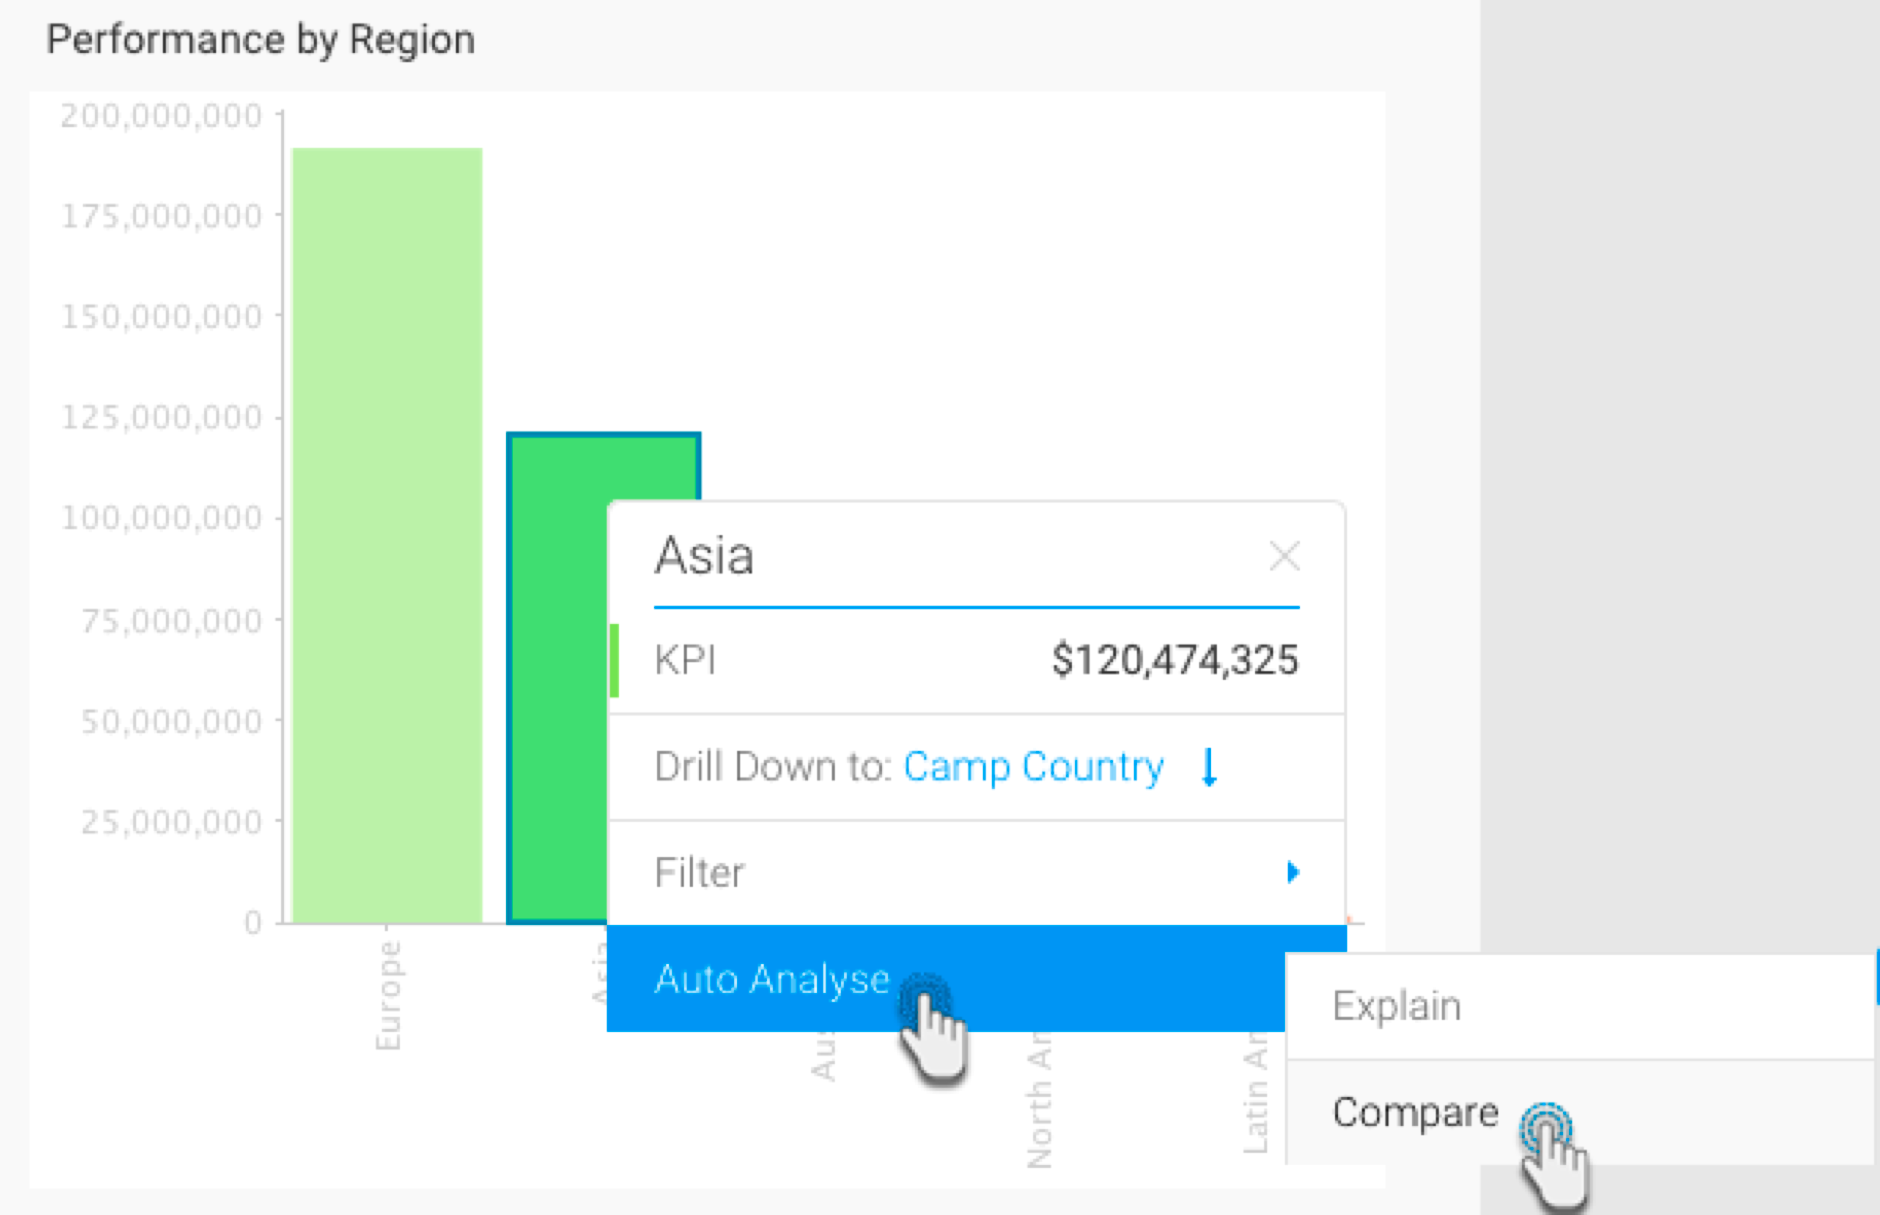
- Right-click on a chart element (bar, data point) or hover your cursor over it to bring up the tooltip.
- Click on the Auto Analyse option, and then select Compare.
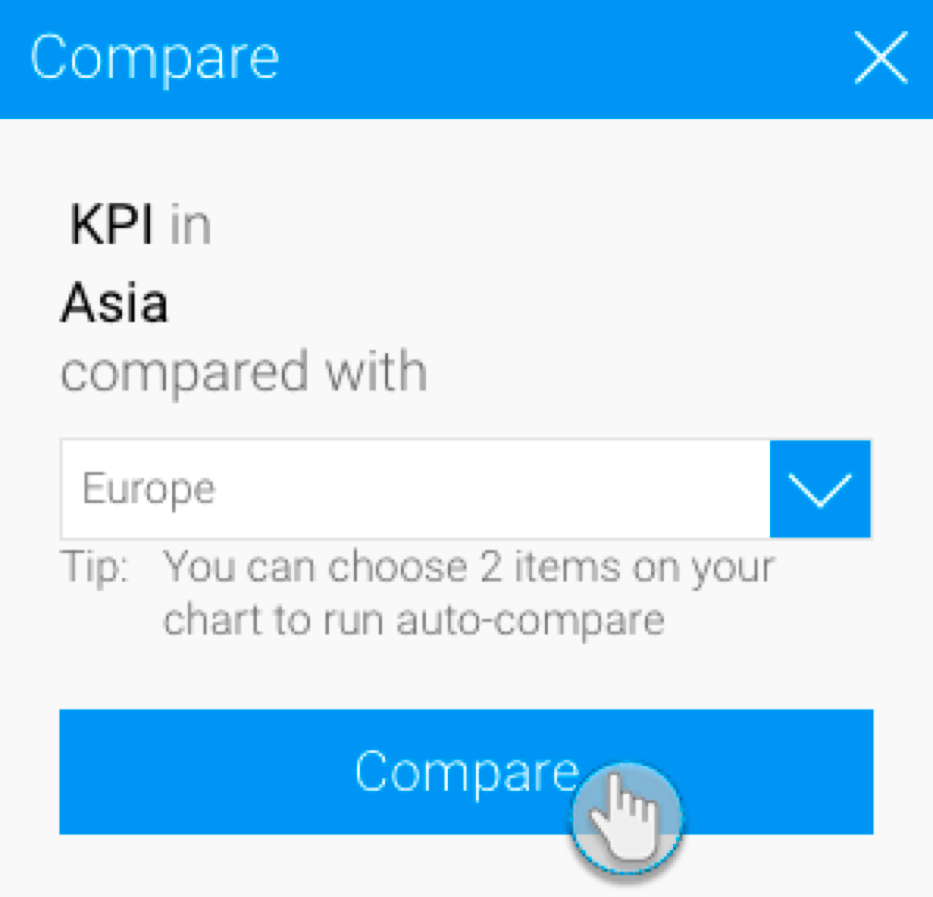
- Select the data that you want to compare to from the list in the popup that appears.
- Click on the Compare button.
- Note: Alternatively, you can select two bars to compare by clicking and dragging the cursor over them (brushing).
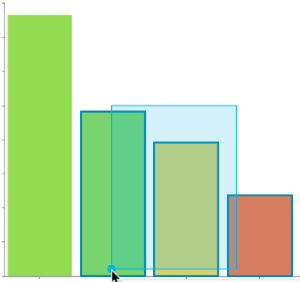
- Or, clicking on one, pressing the Shift key and selecting the other one.
- Note: Alternatively, you can select two bars to compare by clicking and dragging the cursor over them (brushing).
- The result of the comparison will appear in the form of an Insights panel displaying charts with explanations, based on your selected data.

Sharing your insights with others
Once insights appear in the Auto Analysis panel, you can save these to be used later or to share them with other users.
...