Page History
...
Yellowfin Stories gives you the power to include multiple types of content to your Story. This includes text narratives, reports, images and videos. You can add, edit, or delete content in this builder much like any other word processing tool.
| Anchor | ||||
|---|---|---|---|---|
|
Story Narrative
Add text to provide context to your story:
...
You can copy text from your Story, into another section of the same Story. In doing so, any formatting applied to the copied text will be retained when it is pasted. However, text copied from an external source, will not keep any of its original formatting.
...
| Anchor | ||||
|---|---|---|---|---|
|
Embedding Reports
You can add analytical reports to your Story. When adding a report, there are 3 types of content that you can add:
...
- Click on the plus button at the start of a new line. (Note if you do not see this button, simply click on a new line. The button will appear if no text gets entered.)

- Then select the report icon from the reanimated menu.

- A popup will appear displaying all the reports that you have access to.

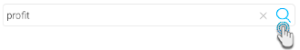
- You can filter out relevant reports, snapshots or bookmarks in this popup by typing the name in the Search bar. Then click on the search icon at the end of the search bar.
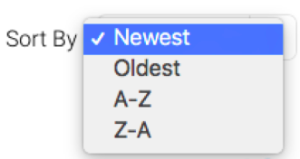
- You also have the option of sorting the reports. Click on the Sort By button and select how you want to items to be sorted in this popup.
- You can choose to view the reports as thumbnails or in a list.

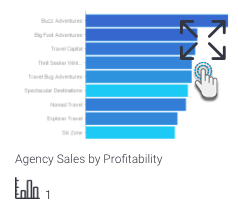
- Click on the expand icon over a report's thumbnail, to maximise its image.
- Click on a report thumbnail to select it. (You can select multiple reports to include them to the Story.)
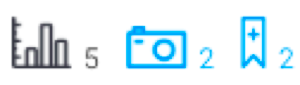
- Note that each report will display summarized information, such as the total number of its existing charts, bookmarks and/or snapshots. (You can click on the snapshot or bookmark icons to view those items for the specific report.)
- To include a snapshot to the story, click on the Snapshot tab at the top-left and then on the thumbnail of a snapshot.

- Similarly, follow the same steps to include one or more bookmark(s).
- Note: You can select multiple items to include them into the story at the same time. The order in which they are added to the story will depend on their order of selection.
- Once you've made all the selections, click on the Insert to Story button. The selected items will be included in your story.

- Each item will include a caption that can also be edited.

- The default formatting of the snapshot and bookmark captions indicate the artifact type, followed by the report name and ending with the name of the snapshot/bookmark.
- You can use the edit menu to change the display of the report artifact. Refer to the section below to learn more.
- Note that live reports and bookmarks will be automatically refreshed every time you access the story as their data may be changed. This may affect your story. (Snapshots will not be updated even if the data has changed, since they always remain static.)
- You can interact with report artifacts embedded in Stories. Interactions that are supported, include tooltips, drilling, keep/exclude filtering, brushing, annotation.
...
| Anchor | ||||
|---|---|---|---|---|
|
Report display options
Hover over a report to bring up the report menu. This includes options to let you resize the report's displayed size, choose the report view to display in the story, that is the chart, table, or canvas, or let you view the report in the Report Builder.
Note: If an icon is dark, then that means it is enabled. Whereas, grey means that the functionality is not applied. Click on a greyed out icon to apply that functionality. For example, clicking on the grey 'table' icon will display the report's table.
Icon | Description |
| This resizes the report to a smaller size. You can switch between the small or big size of the report. |
| Increases the displayed size of the report. (Enabled by default.) |
| Displays only the report chart. In case of multiple charts, a popup will appear indicating the user to select one of the charts to be included. Click here for more details. |
| Displays the report table. Fits the size, but can be scrolled horizontally and vertically. |
| Displays the report canvas. (Disabled by default, and only available if the added report has a canvas.) |
| Redirects you to the report 'design' page, where you can edit the report and re-publish it. The changes will be reflected in a live report added to the Story. You can also use this to replace the report with a snapshot or bookmark, or add another artifact of the same report to your Story. Learn more here. |
...
...
| Anchor | ||||
|---|---|---|---|---|
|
Replacing Reports
Report artifacts, such as live reports, snapshots and bookmarks, that have been added to a Story, can be replaced.
...
Besides text and reports, you can include additional content such as images, videos and even dividers into a Story.
| Anchor | ||||
|---|---|---|---|---|
|
Adding an image to a Story
...
Icon | Size option | Description |
| Original | Displays the image in its actual size. This option only appears if the original image width is less than 700 pixels. |
| Fit | Displays the image to fit the Story size, which is 700 pixels (that is, the image width will be stretched to 700 px while maintaining the aspect ratio). The image is displayed in this size by default. |
| Wide | The maximum size an image can be displayed in. (This option will stretch the width to 900 pixels, while maintaining the aspect ratio.) |
...
| Anchor | ||||
|---|---|---|---|---|
|
Embedding a video to a Story
...
Note: Although the video image will be displayed in a Story while in draft mode, it can only be played when the Story is published.
...
| Anchor | ||||
|---|---|---|---|---|
|
Adding a divider
Include a divider in your story to display a horizontal line that's used to divide your story content.
- Click on the plus button at the start of a new line. (Note if you do not see this button, simply click on a new line. The button will only appear if no text gets entered.)
- Then select the divider icon.

- A horizontal line will appear.
...
| Anchor | ||||
|---|---|---|---|---|
|
Deleting Content
You can delete an attached content, such as a report, image, video, etc, by selecting the item and pressing the backspace or delete key.
...