Page History
...
Icon | Description |
| This resizes the report to a smaller size. You can switch between the small or big size of the report. |
| Increases the displayed size of the report. (Enabled by default.) |
| Displays only the report chart. In case of multiple charts, a popup will appear indicating the user to select one of the charts to be included. Click here for more details. |
| Displays the report table. Fits the size, but can be scrolled horizontally and vertically. |
| Displays the report canvas. (Disabled by default, and only available if the added report has a canvas.) |
| Redirects you to the report output page, where you can edit the report and re-publish it. The changes will be reflected in a live report added to the Story. You can also use this to replace the report with a snapshot or bookmark, or add another artifact of the same report to your Story. Learn more here. |
...
| Anchor | ||||
|---|---|---|---|---|
|
...
If you add a secure report that is inaccessible to all your readers, then that report will be hidden for them in the story, with a message notifying them of the reason they can't view the report content. See the example below: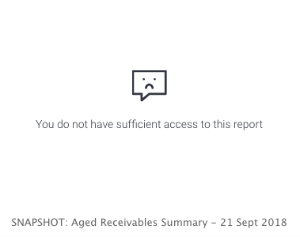
...
| Anchor | ||||
|---|---|---|---|---|
|
External BI Content
You can incorporate reports from other reporting tools, such as Tableau, PowerBI, or Qlik, into your Yellowfin Story. This is done by providing a report link that embeds the report.
| Note | ||
|---|---|---|
| ||
Before you begin, ensure that you have a proper Yellowfin license that supports Stories and the external content add-on. Users who want to embed external reports, will also require an additional user role function, called External Content, enabled. |
Follow the steps below to add a report from external BI tools.
Click on the plus button at the start of a new line. (Note if you do not see this button, simply click on a new line. The button will only appear if no text gets entered.)
Select the 'reporting tools' icon from the menu.
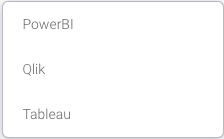
This provides you with a selection of available reporting tool choices. Select one whose content you would like to embed into your Story.
A popup menu will appear. Provide the link to your external report here.
Then click Insert.
Note: Ensure that you put the correct link for this to work. If you accidentally provide a link to a PowerBI report while choosing the Tableau option, an error will occur.
Once the report appears on the screen, you can even resize it. To do so, hover over the report, and when the resize option appears at the bottom right of the report, click and drag it to change the size of the embedded report.
You can also provide a caption for this report, by clicking directly under the report.


...
Other Story Content
Besides text and reports, you can include additional content such as images, videos and even dividers into a Story.
...