Page History
...
Yellowfin has the capability to render GIS data (points and polygons) into an image which can be overlaid with your report data. To enable GIS reporting you must have GIS data available in the database you wish to query for reporting.
| Anchor | ||||
|---|---|---|---|---|
|
Chart data options
Option | Description |
|---|---|
Geo Field | The field containing the GIS data. |
Color | A metric field that is represented on the map. |
Tooltip | A value that is contained in the tooltip. |
GIS from a Non-GIS Supported Database
Not all databases support GIS natively. However, Yellowfin can convert varchar convert varchar fields into polygons. So if your database does not have a GIS field type, you can still store your GIS polygons in that database as a varchar.
...
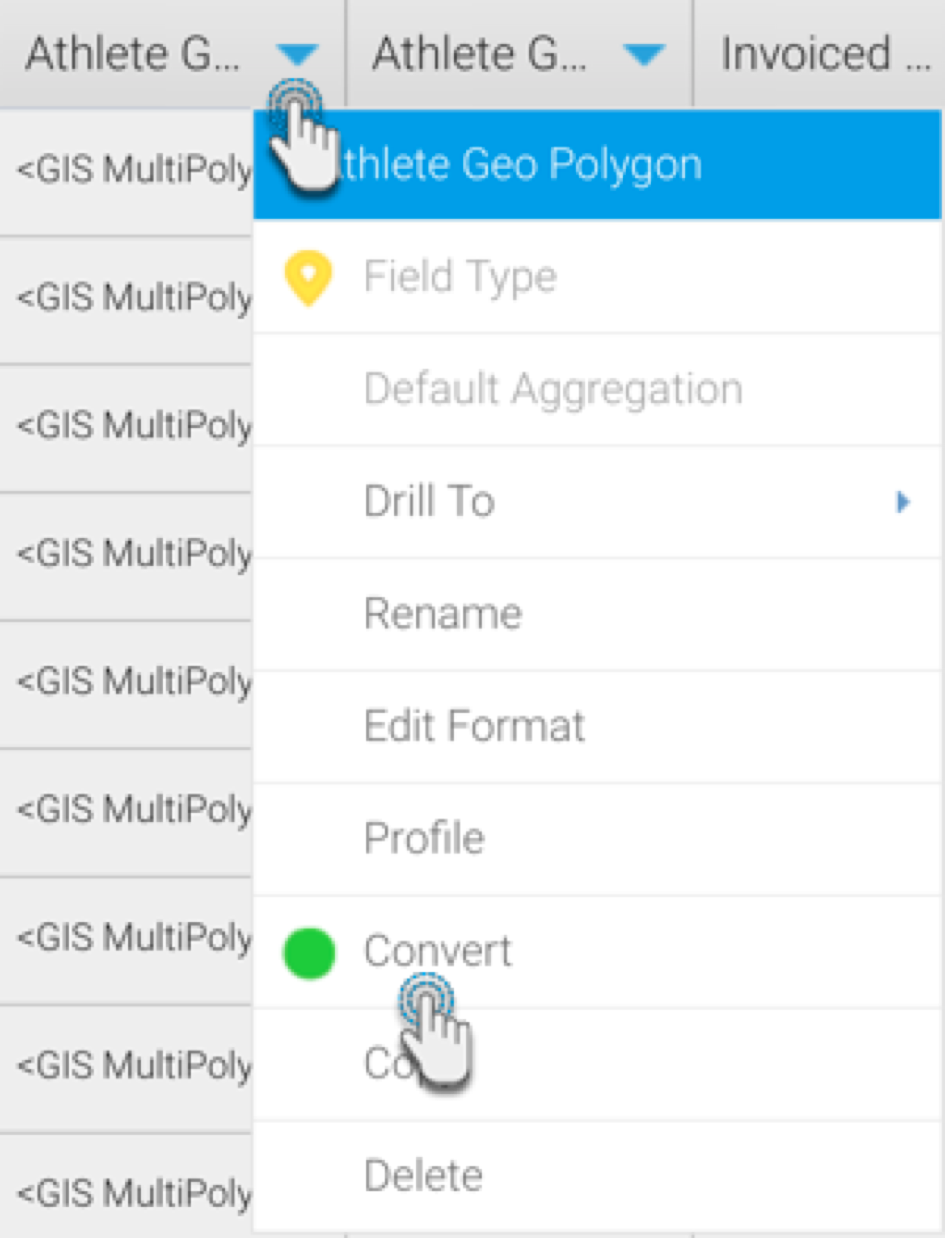
- Edit the view of your dataset, and jump to the Prepare step.
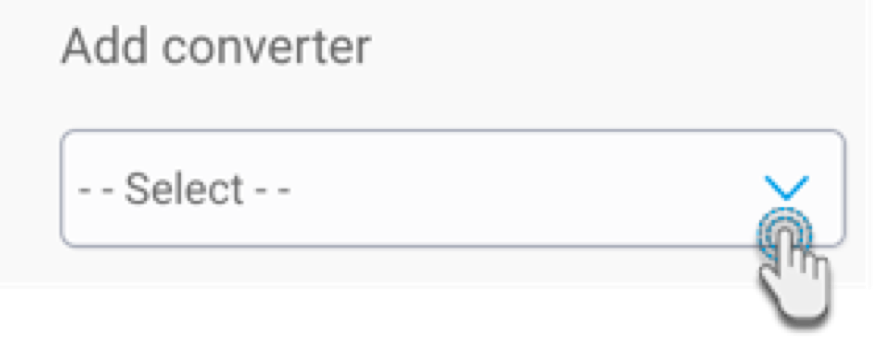
- Click on the dropdown menu of the varchar field, and select Convert.

- Once the converter popup appears, select WKT Geometry as the converter type.
- Your selection will navigate you to the next screen. Set the text format as Longitude/Latitude.
- Next choose the Cache Field. This should be a unique identifier for the polygon.
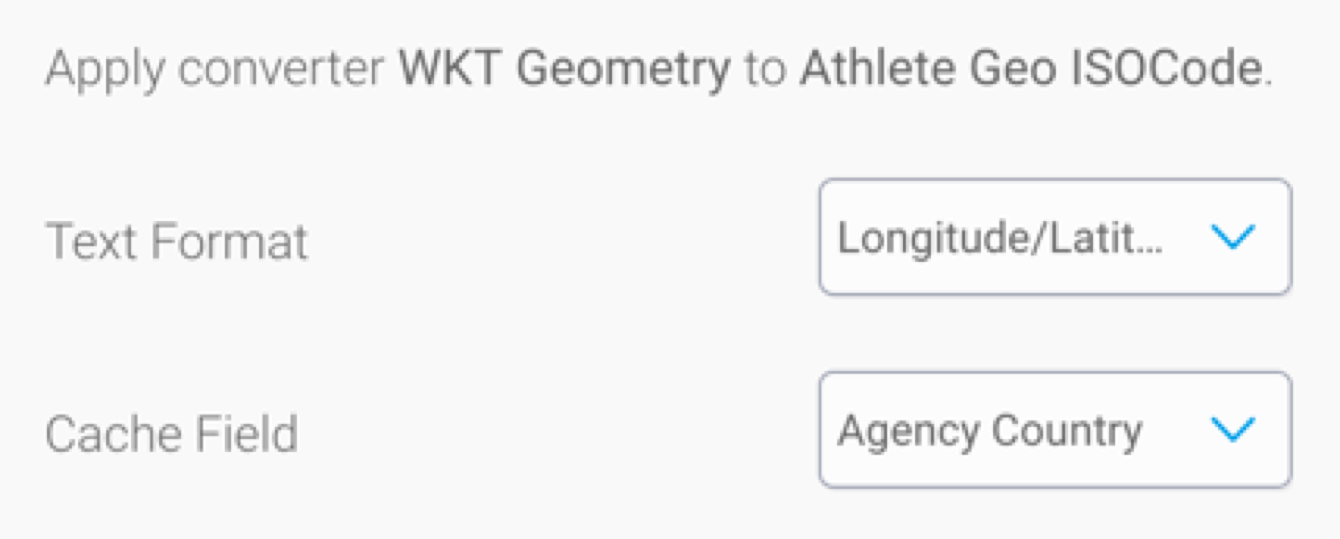
- Click Save.
- On the next page, you will see a message stating the conversion.

- You can also delete any applied conversions by hovering over them, and clicking on the delete icon.
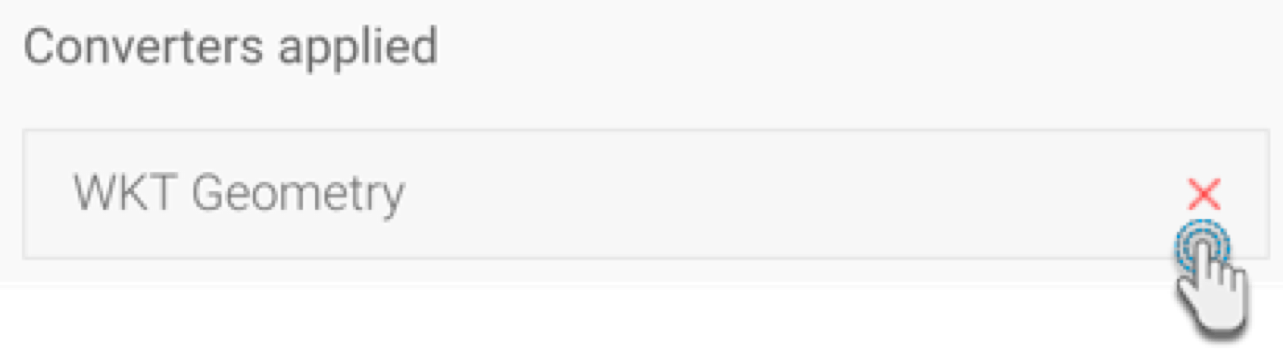
- Click Close to exit the converter.
- Publish the view to save these updates. Now you can begin creating your GIS report.
...
| Anchor | ||||
|---|---|---|---|---|
|
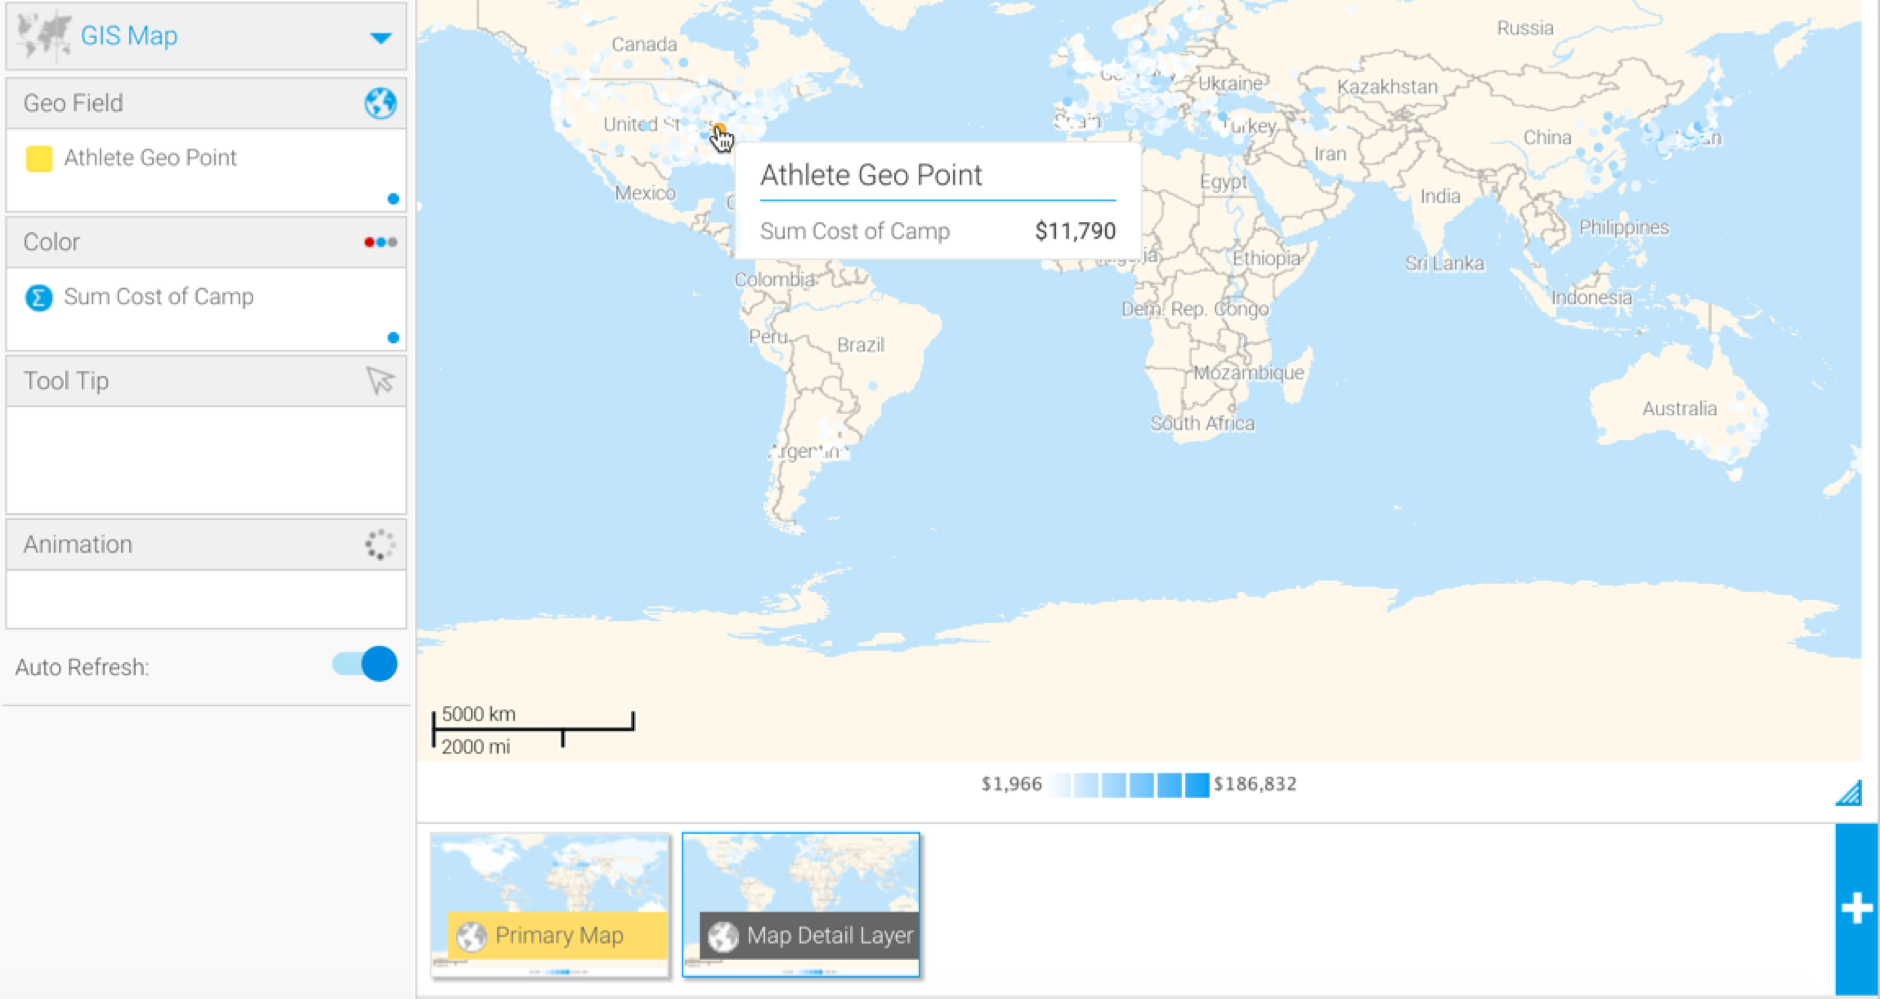
How to use a GIS Map
This tutorial demonstrates how to use a GIS map with your dataset.
- Click on the Create button and select Report to begin building your report.

- Select your preferred View containing the GIS data. For the purpose of this example, we will choose Ski Team.

- When at the Report Builder page, add your required data, including the GIS and metric data fields to the report. For example, we will use the Athlete Geo Polygon, and Sum Invoiced Amount fields in our report.
Click below to see an optional formatting tip to display geopoint or geo polygon data is its original form.
//Additional tip on formatting GIS data - maybe link to it on a separate pageExpand title Formatting tip... By default, the report builder formats geopoint or geo polygon data to ‘Default Geometry’ (so it’s displayed like in the example below). However you can view geo points or polygons in their original form by changing the formatting.
- To do so, click on Format in the geopoint column menu, then select Edit.
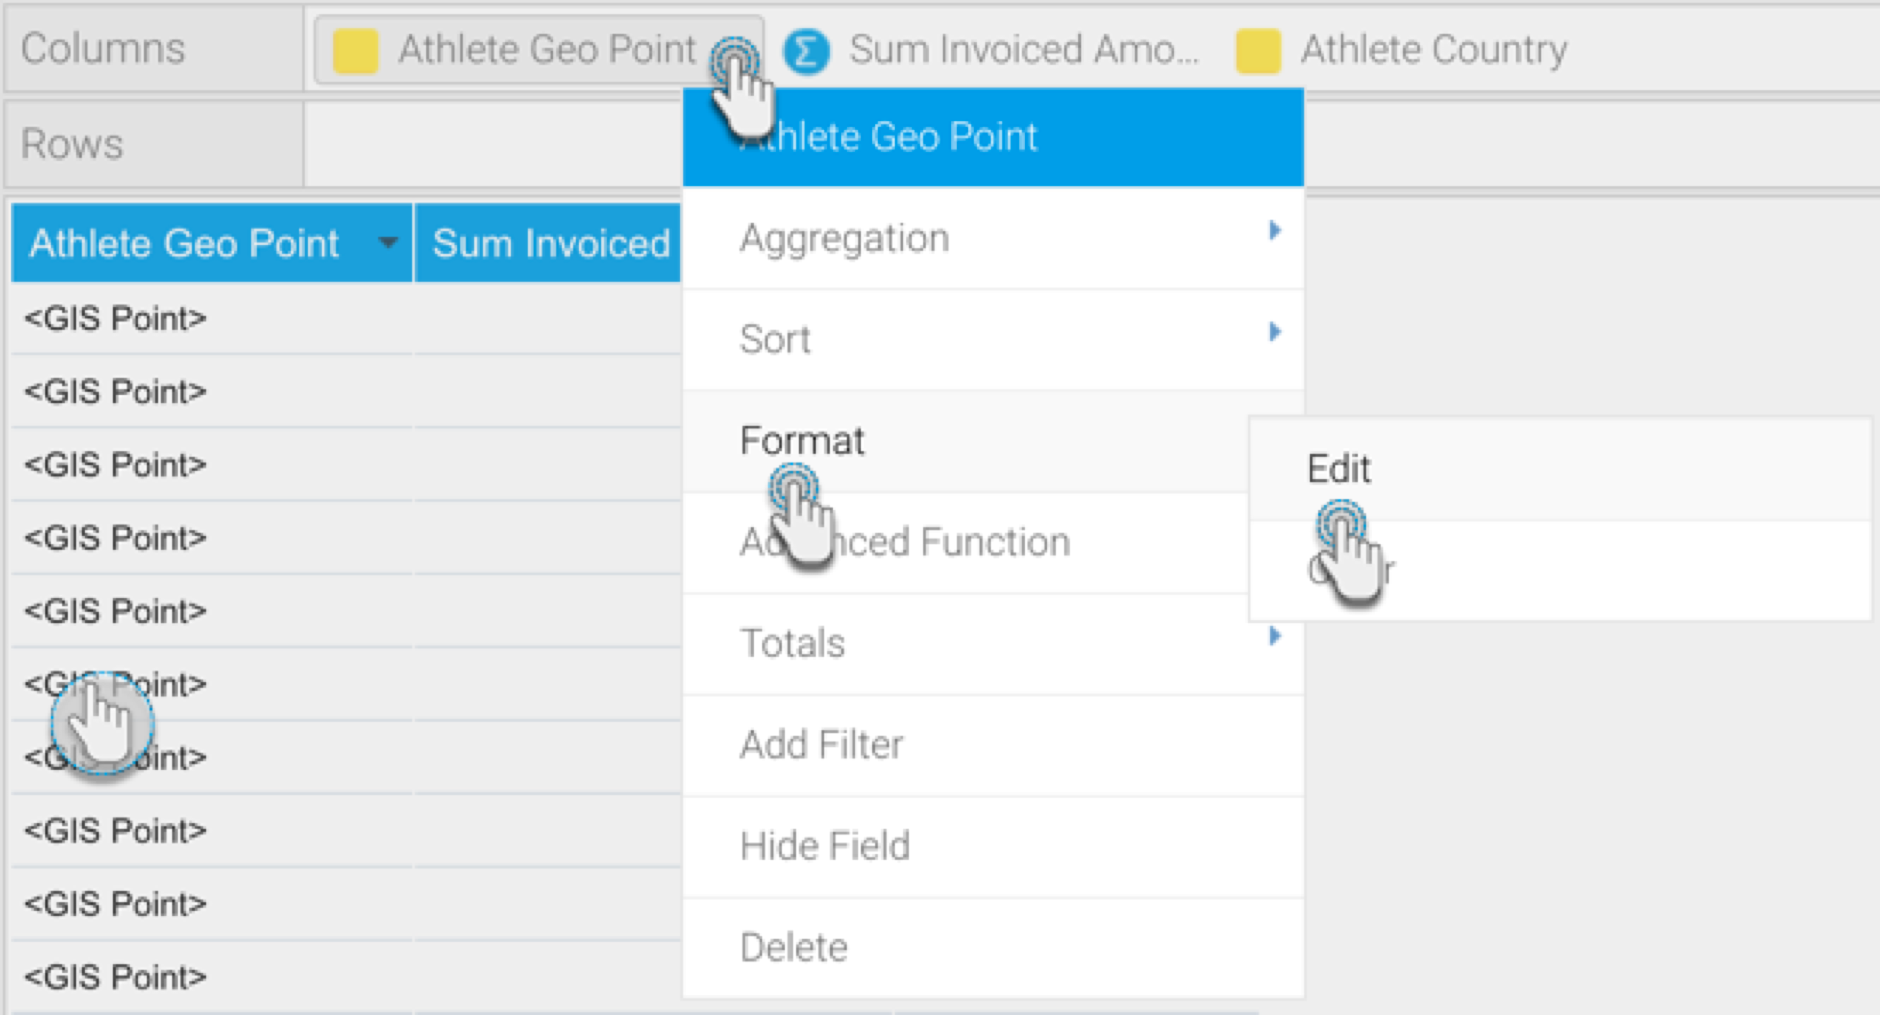
- Then select ‘Raw Formatter’ from the Format field in the popup.

- Close the popup. The geopoint data will be visible in its original form in the report.

- Warning: Note that applying raw formatting on a large geopoint or geo polygon data set, may slow your report’s processing time.
- To do so, click on Format in the geopoint column menu, then select Edit.
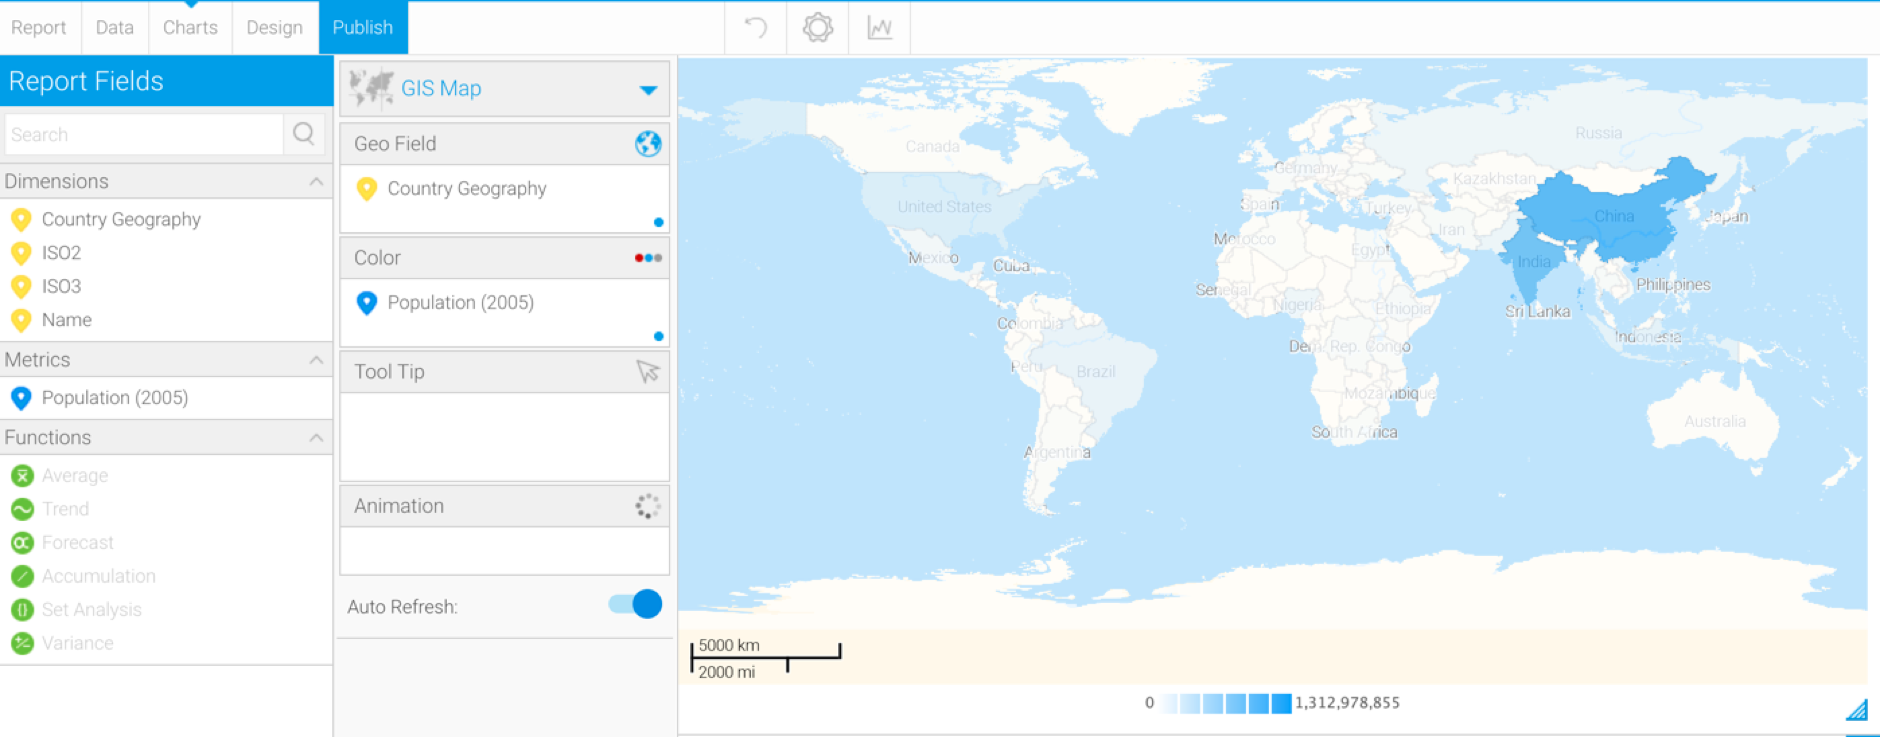
- Navigate to the Charts page, and expand the chart selection menu. Choose GIS Maps from this selection.
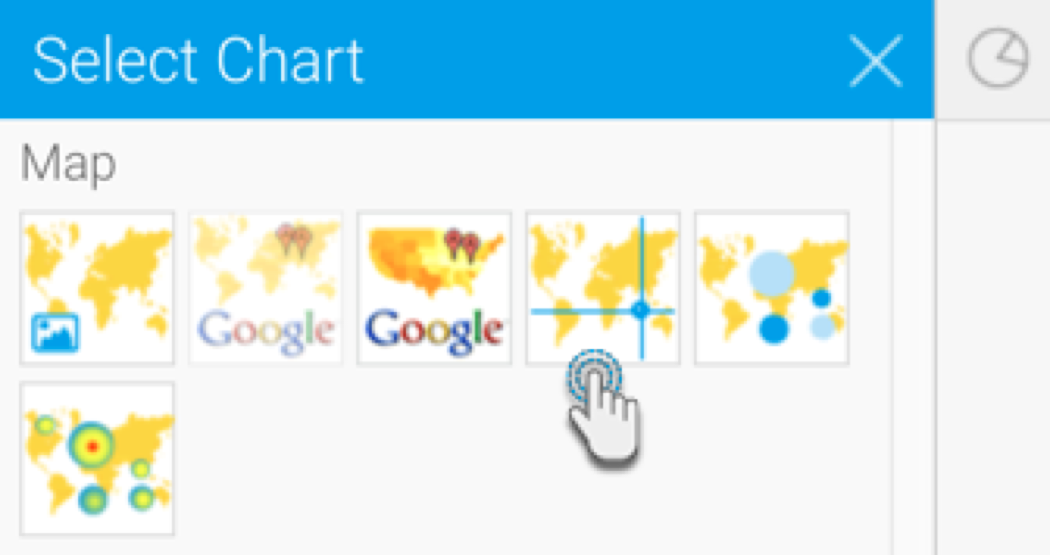
- Next, fill the required fields for your GIS chart, for example drag Athlete Geo Polygon to the Geo Field component. You can refer to the above Chart Data Options section for a description of all the fields.
- You will be able to see your GIS map chart. The polygons will be colored based on the value of the Color field.

- The above example shows the default background image (World image) of the GIS map that provides context to the location.
- You can hide this image by configuring the map settings. There’s two ways to do so:
- Click Chart SettingsSettings, expand Style, and disable the GIS Base Layer toggle.
- Go to Administration > Content Setting > Maps Settings and disable the GIS Base Layer toggle.
- You can also use the chart formatting settings to further configure your Google chart. Refer to our chart formatting section for more information.
- Or you could add a layer to your map chart. Learn more about this here.
- Once done, save your map.
{ add config here: https://wiki.yellowfinbi.com/display/user80/Chart+Formatting#ChartFormatting-ChartSettings > Style
GIS Base Layer - Display or hide a base layer under your GIS map to provide location context.}
Adding
...
map
...
layers
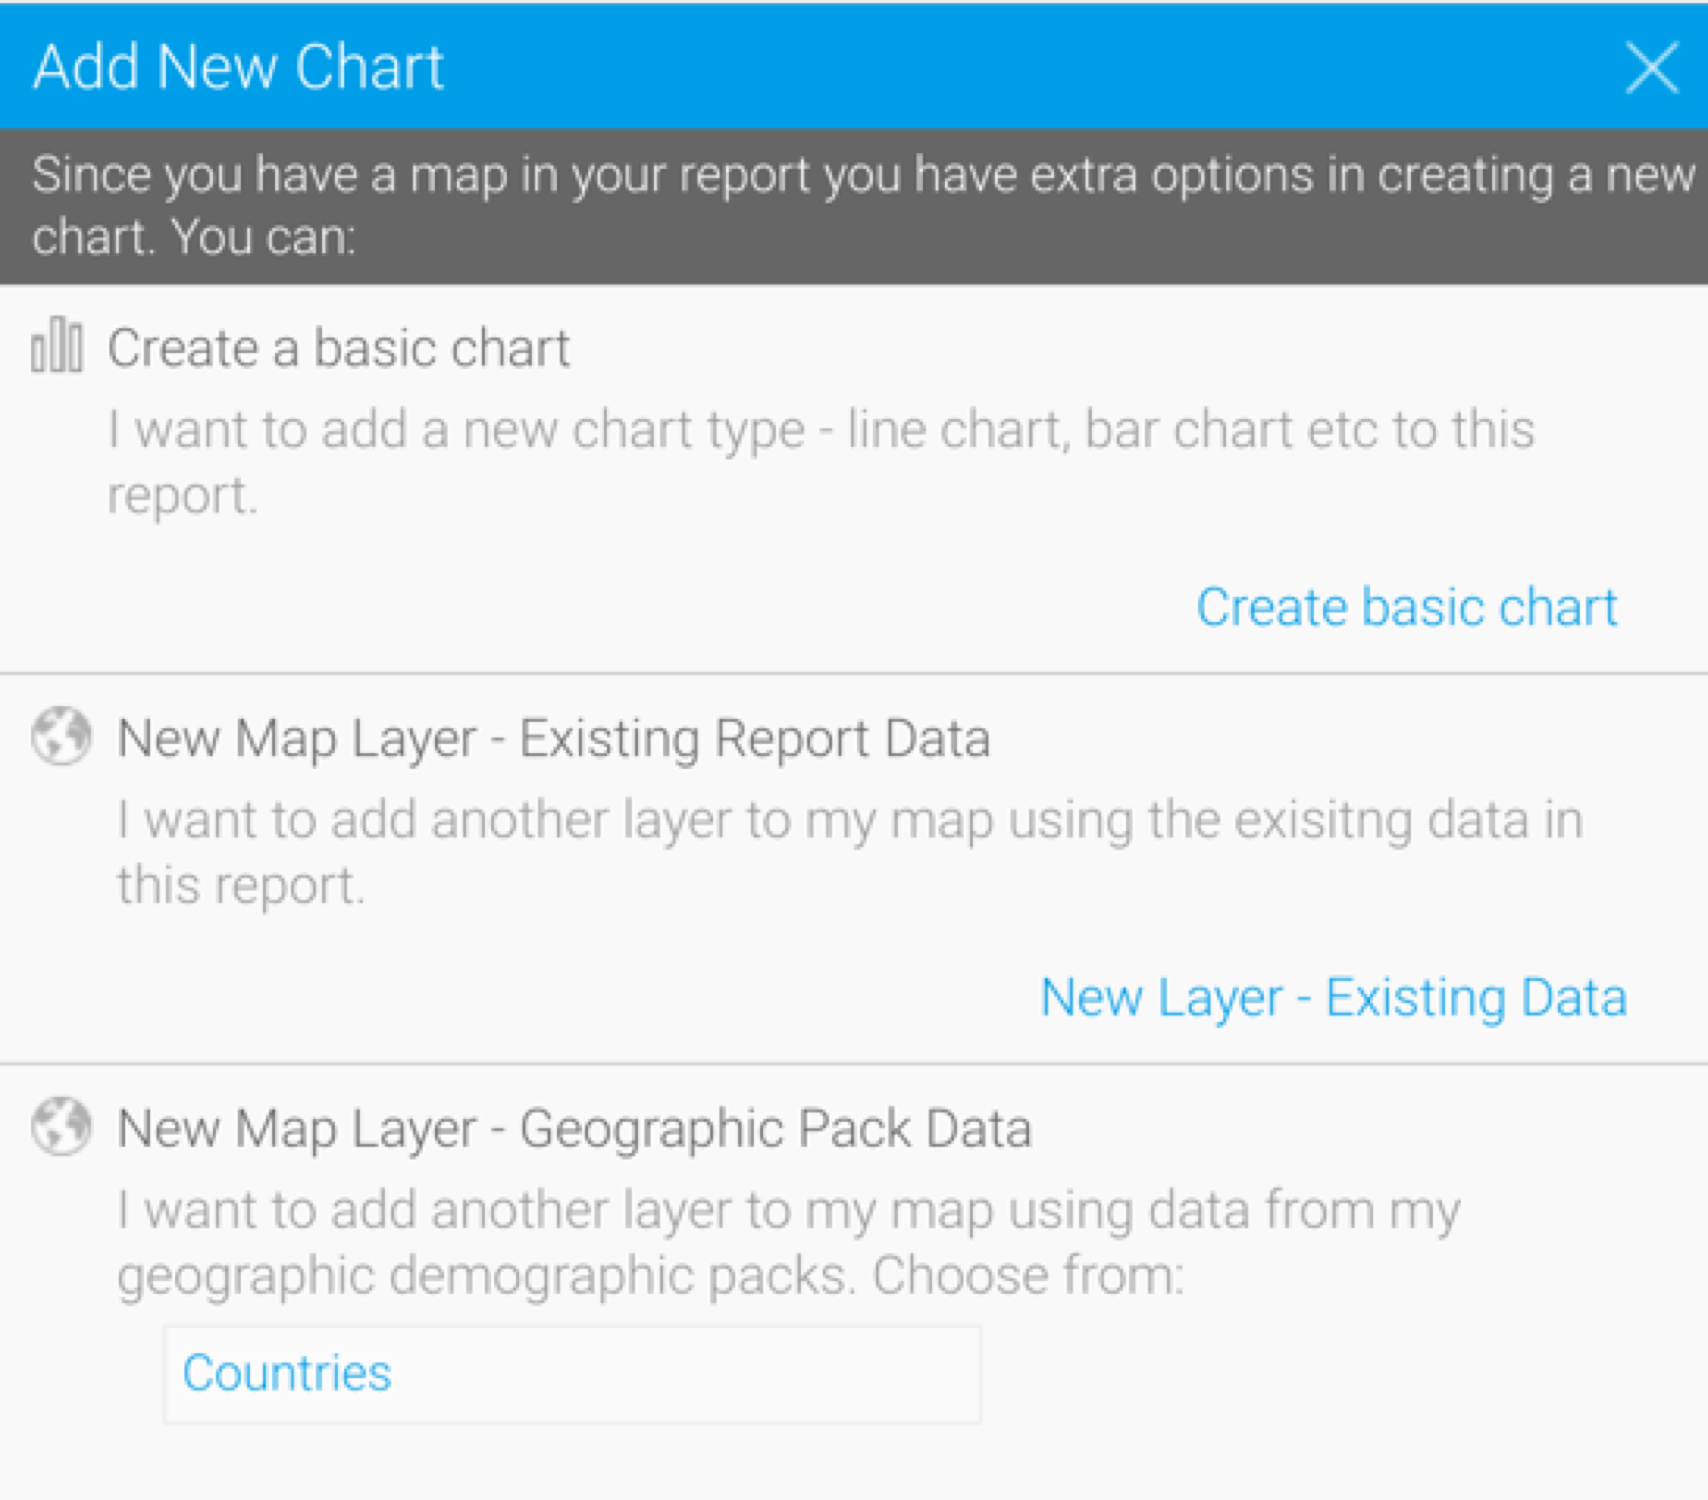
Once you have created a primary map, you can add additional layers on top. Each layer can contain a different detail, giving you a chance to build upon your map.
Here’s how to add a layer to your GIS map:
- Click on the + button on the bottom-right of the screen (for a GIS map, this provides extra options, as opposed to only creating a new chart).
- When the following popup appears, choose one of the two options to add a layer to your map:
- New Map Layer - Existing Report Data: Use this option if you new layer will use data already in this report.
- New Map Layer - Geographic Pack Data: Use this option if you want to use data from a Geographical pack in the new layer. Note that you can get ready-made geographical packs from the Marketplace to add to your Yellowfin instance.

- If you selected the Existing Report Data option, then your selection will create a new layer in the chart builder, with existing field data. Drag these fields to the chart components to create the chart layer, much like you would with any chart.
- Alternatively, if you selected a Geographic Pack, then the chart builder will display data from the selected Geopack. You can create your map layer by using this data.
- Once the map layer is created, you’ll be able to see its icon at the bottom of the chart builder, differentiating it from the main or primary map.
Note: learn more about the GIS Settings option in the chart formatter here
...
- .