Page History
| Anchor | ||||
|---|---|---|---|---|
|
| Table of Contents | ||
|---|---|---|
|
Overview
| Styleclass | ||
|---|---|---|
| ||
Chart Data Options
Option | Description |
|---|---|
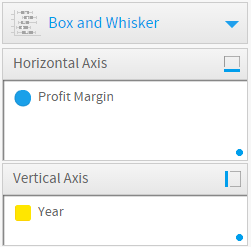
Horizontal Axis | Select at least one metric to analyse in the chart. |
Vertical Axis | Select a label to split your series up by. |
Box & Whisker Tutorial
| Styleclass | ||
|---|---|---|
| ||
Summary
In order to set up a Box & Whisker Chart you will need:
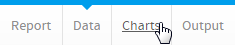
- Create a report with chart display
- Select a field to use as the Vertical Axis
- Select a field to use as the Horizontal Axis
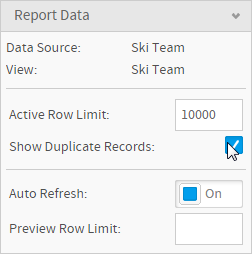
- Enable the display of duplicate records
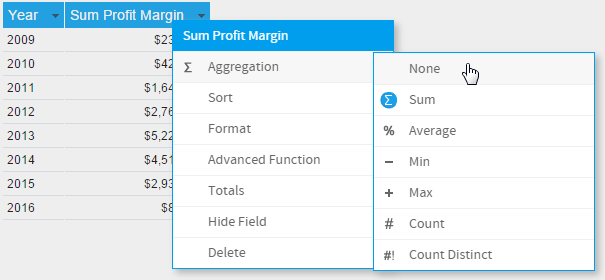
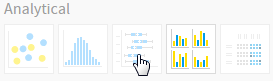
- Create your chart, selecting Box & Whisker as the type under the Analytical heading
- Provide the Horizontal and Vertical axis options
- Customise the Chart as required
- Proceed to the Output step
- Save your report
Tutorial
| Section | ||||||||||||||||
|---|---|---|---|---|---|---|---|---|---|---|---|---|---|---|---|---|
|
| Section | ||||||||||
|---|---|---|---|---|---|---|---|---|---|---|
|
| Section | ||||||||||
|---|---|---|---|---|---|---|---|---|---|---|
|
| Section | ||||||||||
|---|---|---|---|---|---|---|---|---|---|---|
|
| Section | ||||||||||
|---|---|---|---|---|---|---|---|---|---|---|
|
| Section | ||||||||||
|---|---|---|---|---|---|---|---|---|---|---|
|

| Section | ||||||||||
|---|---|---|---|---|---|---|---|---|---|---|
|
| Section | ||||||||||
|---|---|---|---|---|---|---|---|---|---|---|
|
| Section | ||||||||||
|---|---|---|---|---|---|---|---|---|---|---|
|
| Section | ||||||||||
|---|---|---|---|---|---|---|---|---|---|---|
|

| horizontalrule |
|---|
| Styleclass | ||
|---|---|---|
| ||