Page History
| Table of Contents | ||
|---|---|---|
|
| Anchor | ||||
|---|---|---|---|---|
|
Yellowfin Signals allow you This feature allows you to access Yellowfin Signals on the go, making it easier to keep track of all the important changes in your data on the go. The app lets you view and interact with Signals generated by the system.
Signals List
Tap on the Signals option in the app menu. A list of Signals will appear.

Tip: If you see a blank Signal screen, reset the filters, as one of the reasons for this could be that filters are set to view the latest Signals, or those from the 'My Signals' list.

Signal tile
Anchor accessingsignals accessingsignals
Accessing Signals
Signals are accessed in two ways:
- By tapping on the burger bun in the top-left corner, and then tapping Signals to access the Signals list.
- By tapping on a tile in your Timeline that contains a Signal.
Understanding the Signals list
The Signals list displays all available The Signal list displays Signals in the form of tiles. You can interact with these in the following manner.
...
| Column | ||
|---|---|---|
| ||
|

...
, with options for filtering, watching, commenting and performing Signal action items.
| Tip |
|---|
Your Signals list will default to My Signals. If you cannot see any Signals, reset the filters. |
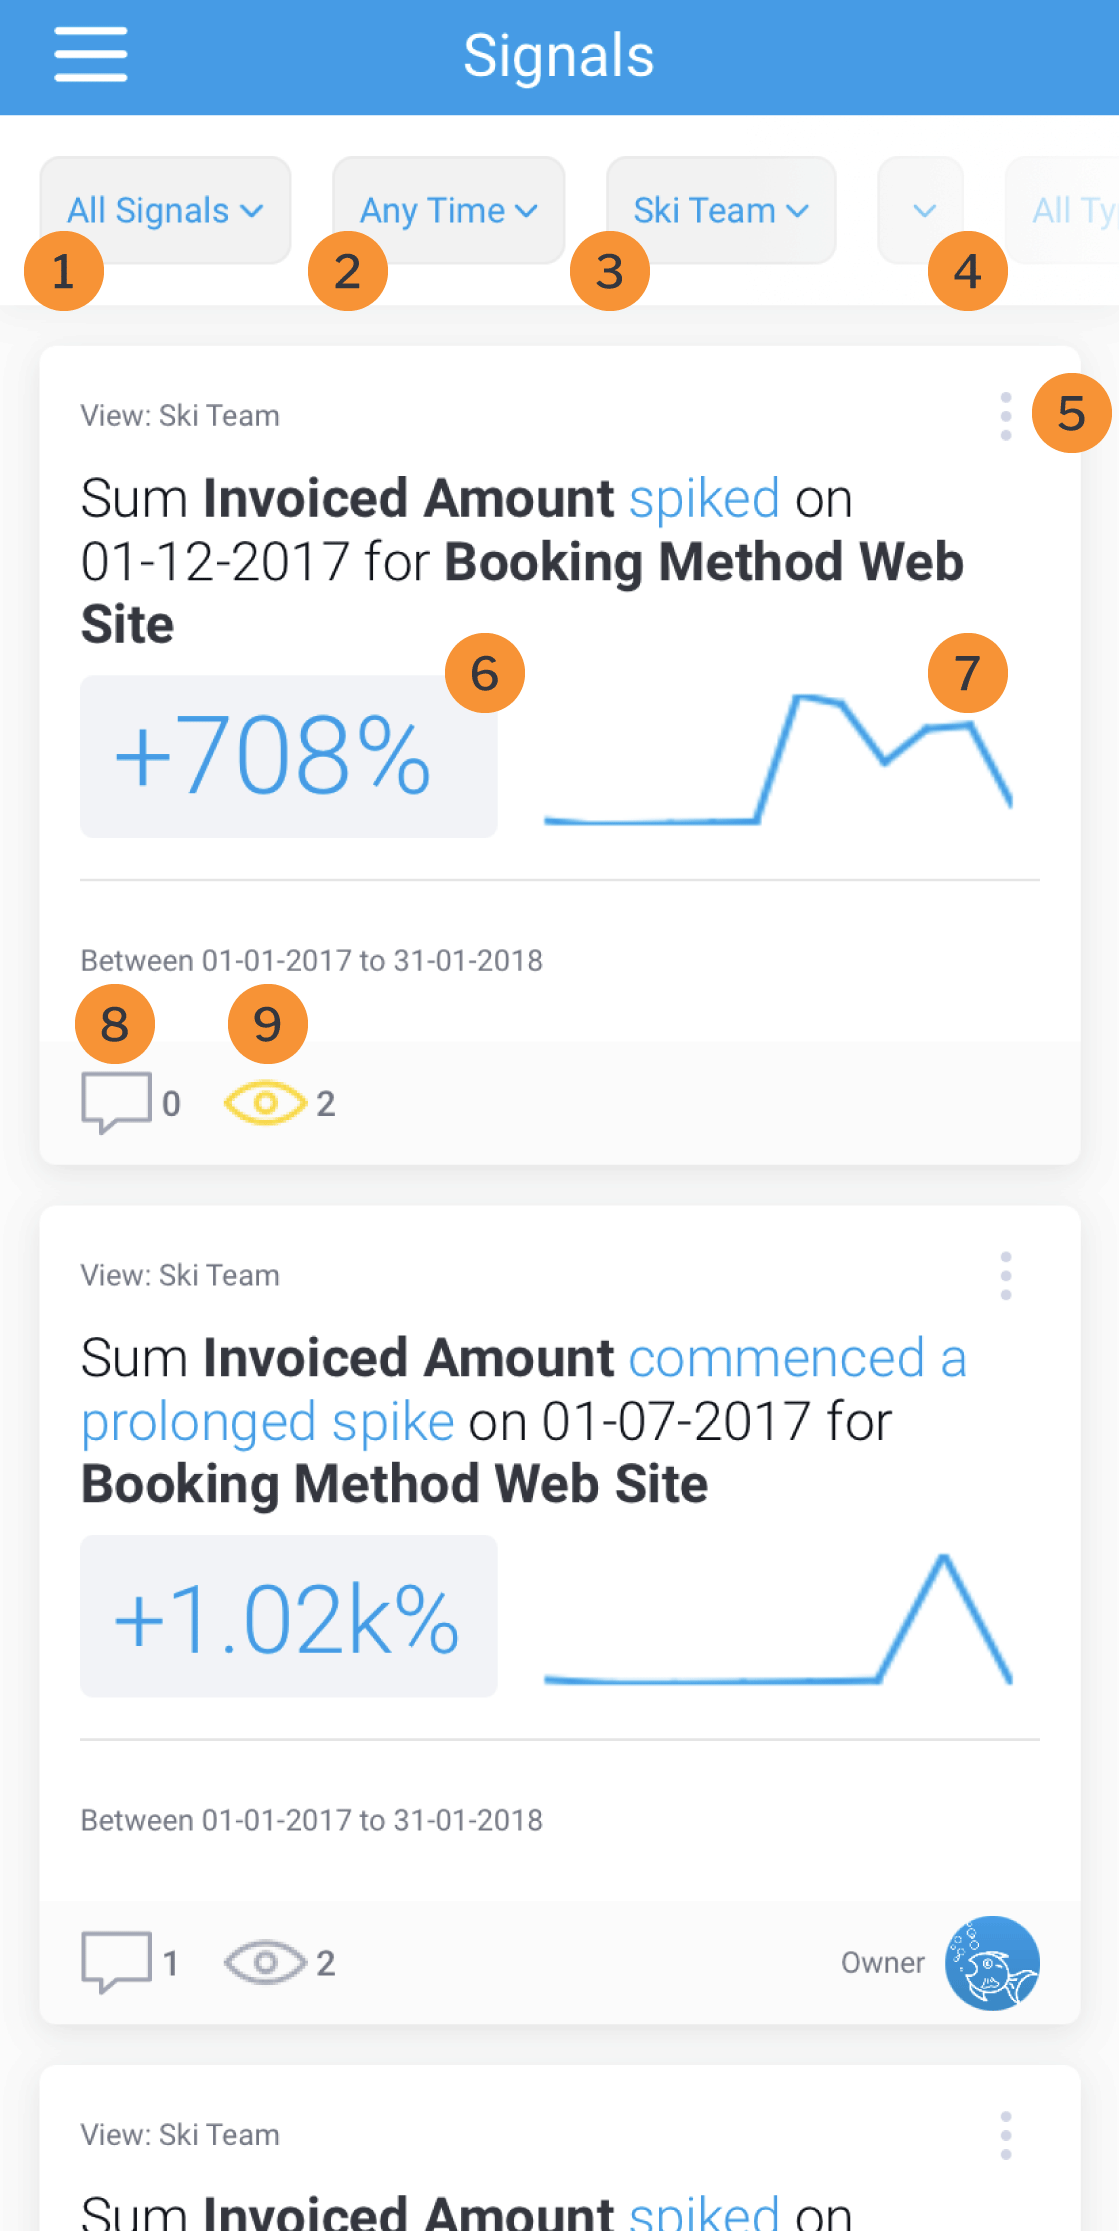
| Number | Feature | Description |
|---|---|---|
| 1 | Status filter | Tap to display Signals based on their status:
|
...
Tap on the metric to view an alternative change value. For example you can switch between the percentage change to the actual change amount.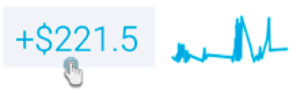
...
Signal Filters
...
| Filter type | Description | |||
|---|---|---|---|---|
| Filter by Signal status | This filter lets you view Signals based on their status. Options include:
| |||
| 2 | Time filter | Tap to display Signals by a predefined time range, eg display | Filter by time | Choose a pre-defined time range to restrict Signals by. For example, you can view Signals that were created within the last 7 days, or the last 90 days.Filter by views |
| 3 | View filter | Tap to display the Signals generated from all views, or choose a specific view to limit the listed Signals based on that view.. | ||
| 4 | Type filter | Tap | Filter by Signal type | Restrict the list to display Signals based on their by type. Tip: If you cannot see the Type filter, scroll Swipe horizontally where all the filters are displayed. |
| 5 | Actions menu |
Signal Detail
Tap the more options button | ||
| 6 | Metric | Tap the metric to view an alternative change value, eg switch between the percentage change to the actual change amount. |
| 7 | Chart thumbnail | Tap the chart thumbnail to open the Signal page. More on that here. |
| 8 | Comments | Tap the speech bubble |
| 9 | Watch | The the eye button |
...
| Anchor | ||||
|---|---|---|---|---|
|
Interacting with Signals
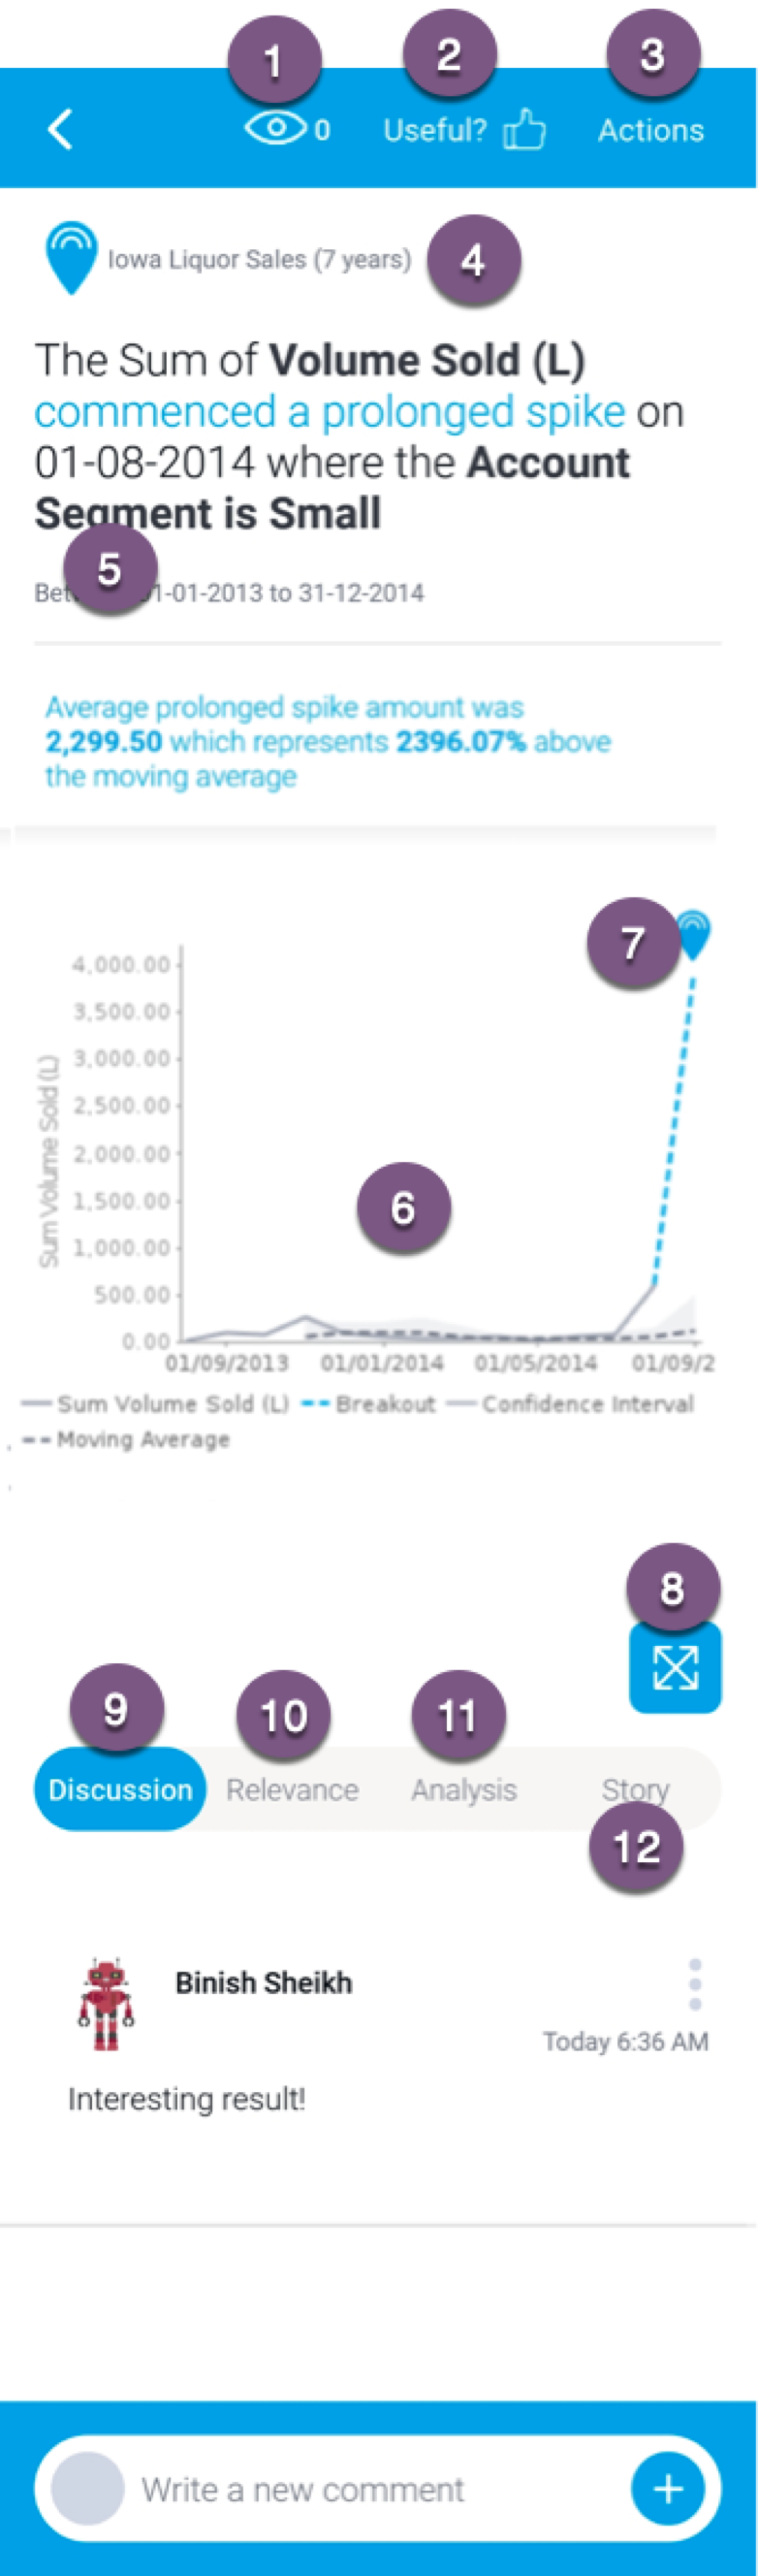
You can interact with Signals in many ways, allowing you to Open a Signal to explore its analysis in detail. You You will see the an auto-generated narrative that describes the nature of the Signal, along with a time series chart that shows the history of the specific metric - /dimension combination. The main Signal is represented as an annotation in the time series chart.
Below is an example of a Signal detail page. You can perform the following functions and interactions.
...
| Column |
|---|
|
Understanding the Signal page
The Signal page shows the details of the Signal. All interactive features are accessible from this page.
...
Number | Feature | Description |
|---|---|---|
1 | Watch |
...
Tap |
...
the eye icon to watch a Signal, or again to stop watching it. |
...
2 |
...
Rate a Signal’s usefulness
...
Rate | Tap to rate a Signal as useful or |
...
not useful. | |
3 | Actions |
...
Tap to perform actions on this Signal |
...
. | |
4 | View name |
...
Displays the name of the view this Signal was detected in. | |
5 | Signal narrative |
...
Displays an auto-generated narrative that describes the nature and magnitude of the Signal, along with the time window in which it occurred. |
...
Color foreshadowing is applied to highlight good (as blue) or bad (orange) results. | |
| 6 | Time series chart |
...
| Displays the |
...
| Signal time-series chart |
...
| highlighting the history of the specific metric |
...
| /dimension combination. | |
| 7 | Signal annotation |
...
| Displays the Signal annotation on the time series chart. | |
| 8 | Expand chart |
...
Tap to expand the time series chart. |
...
| 9 | Discussion |
...
Tap to display discussion on this Signal. | ||
| 10 | Relevance | Tap |
...
to discover how important this Signal is to you. |
...
| |
| 11 | Analysis |
...
Tap to discover the underlying reasons for why the Signal occurred |
...
. | |
| 12 | Story |
...
Tap to display stories written about this Signal, if |
...
any have been published. |
| Anchor | ||||
|---|---|---|---|---|
|
...
Watching a Signal
Click the eye icon to watch or track a Signal. This adds the signal to your watch list (filtered by choosing My Signals), and also sends you Timeline alerts to you if other users interact with it (by leaving comments or changing ownership). This allows “watchers” to always stay updated on a Signal. Users will also be able to see which Signals are being watched by other users and who these users arewhom.
| Anchor | ||||
|---|---|---|---|---|
|
Rating a Signal
...
You can specify the usefulness of each Signal by declaring it as either useful or not, by tapping on the Useful? option. The system Yellowfin takes this into account and applies this rating to optimize the delivery of signals in the future. This ensures that you receive Signals that are related to or similar to the ones you rated as useful, and receive less of those that you rated not useful. You can also change the rating after submitting it.
- Tap on the Useful? option on at the top of the screen.


The following options will appear on the screen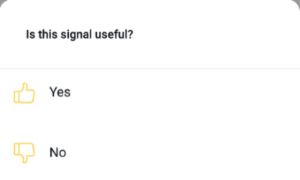
- . Tap on Yes to rate this Signal as useful, or No to deem it useless to you.
rate it not useful
Your rating will be saved and taken into account by the system.
| Tip |
|---|
You can always change the rating by following the same process. |
| Anchor | ||||
|---|---|---|---|---|
|
Performing Signal
...
actions
You can perform unique actions on Signals by tapping on Actions in the top-right corner of a Signal page, or via the more options button ![]() on a Signals tileTap on the Actions button to bring up the following menu of actions that you can perform on a Signal. If the Signal has been assigned an owner, you will be able to see their info here as well.
on a Signals tileTap on the Actions button to bring up the following menu of actions that you can perform on a Signal. If the Signal has been assigned an owner, you will be able to see their info here as well.
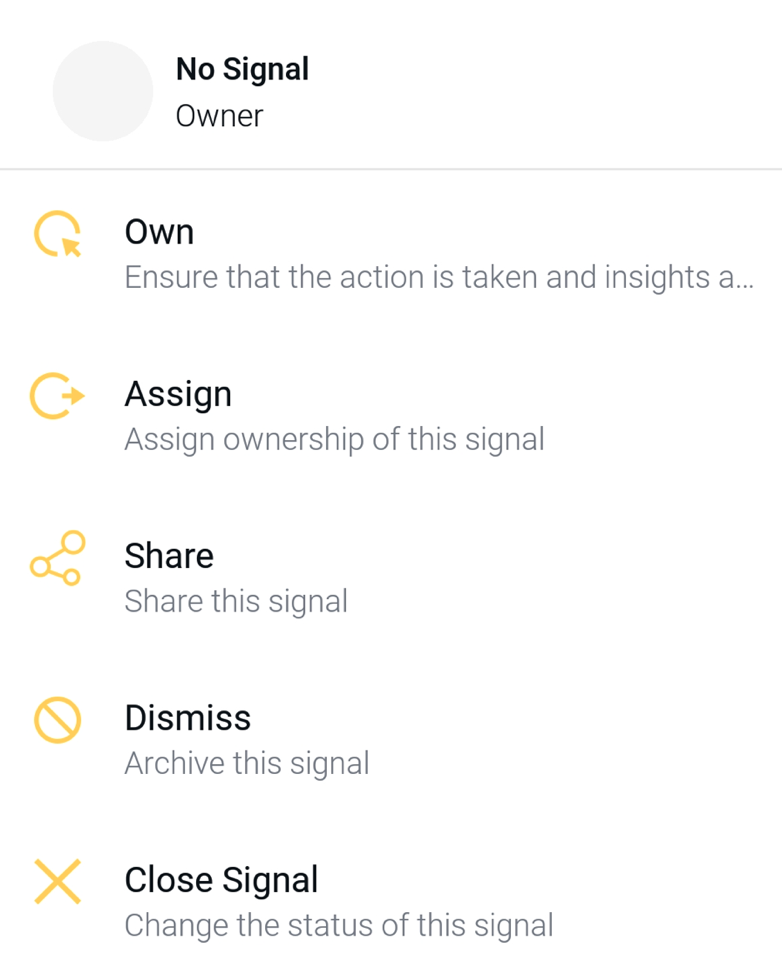
| Action | Description |
|---|---|
| Own |
...
| Tap to assign yourself as the person responsible for a Signal. Owning a Signal allows you to take action on the Signal and |
...
| share insights. |
| Assign |
...
| Tap to assign another user as the person responsible for a Signal. | |
| Share | Tap to share a Signal with other Yellowfin users, provided the recipients have access to the Signal. |
| Dismiss |
...
| Tap to remove the Signal from your list. You can |
...
| un-dismiss a Signal via the Actions menu by filtering for Dismissed Signals |
...
| . |
| Close Signal |
...
| Tap to remove the Signal |
...
| inactive from all user Signals lists so no other actions can be performed |
...
| . |
...
| You can re-open |
...
| a Signal via the Actions Menu by filtering |
...
| for Closed Signals. |
| Anchor | ||||
|---|---|---|---|---|
|
...
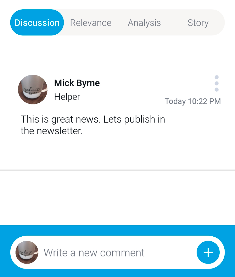
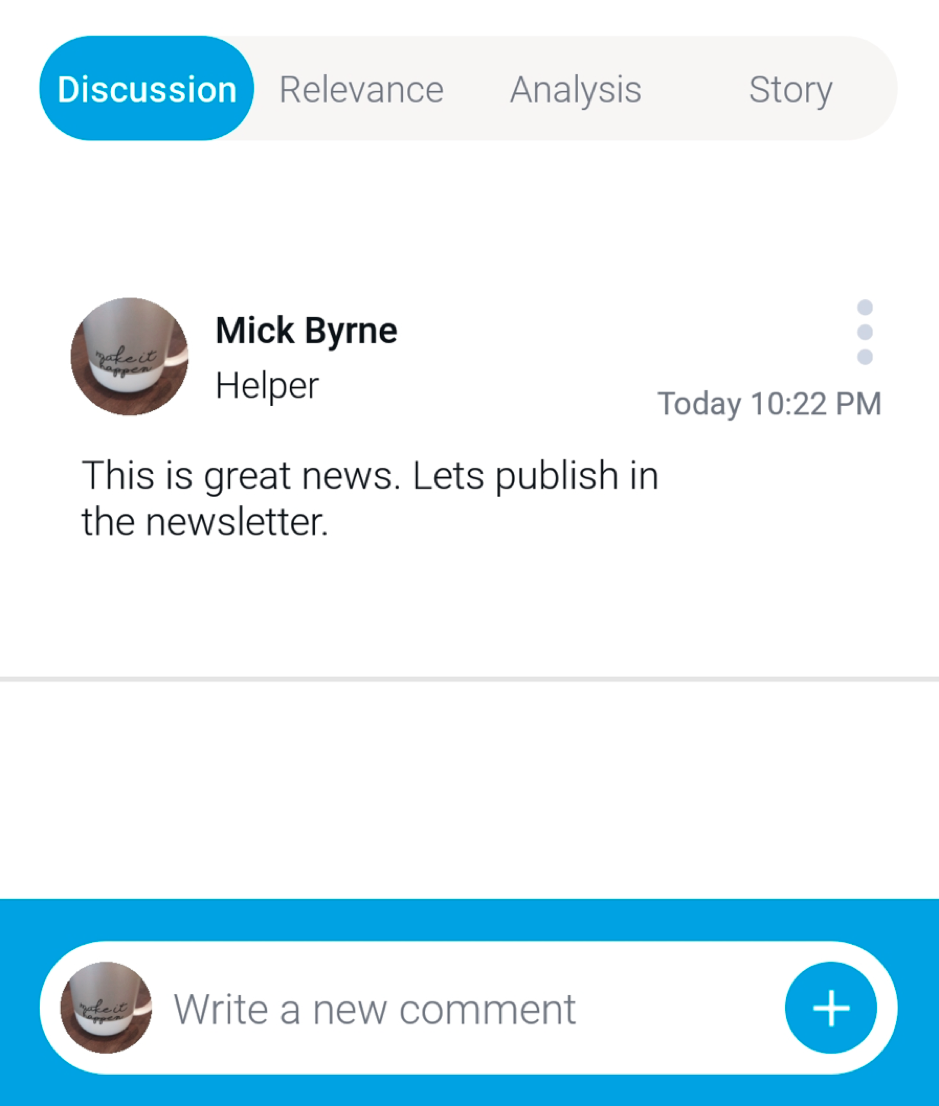
Discussing Signals
Use the Discussion tab to leave comments and collaborate with other users on this Signal.
| Anchor | ||||
|---|---|---|---|---|
|
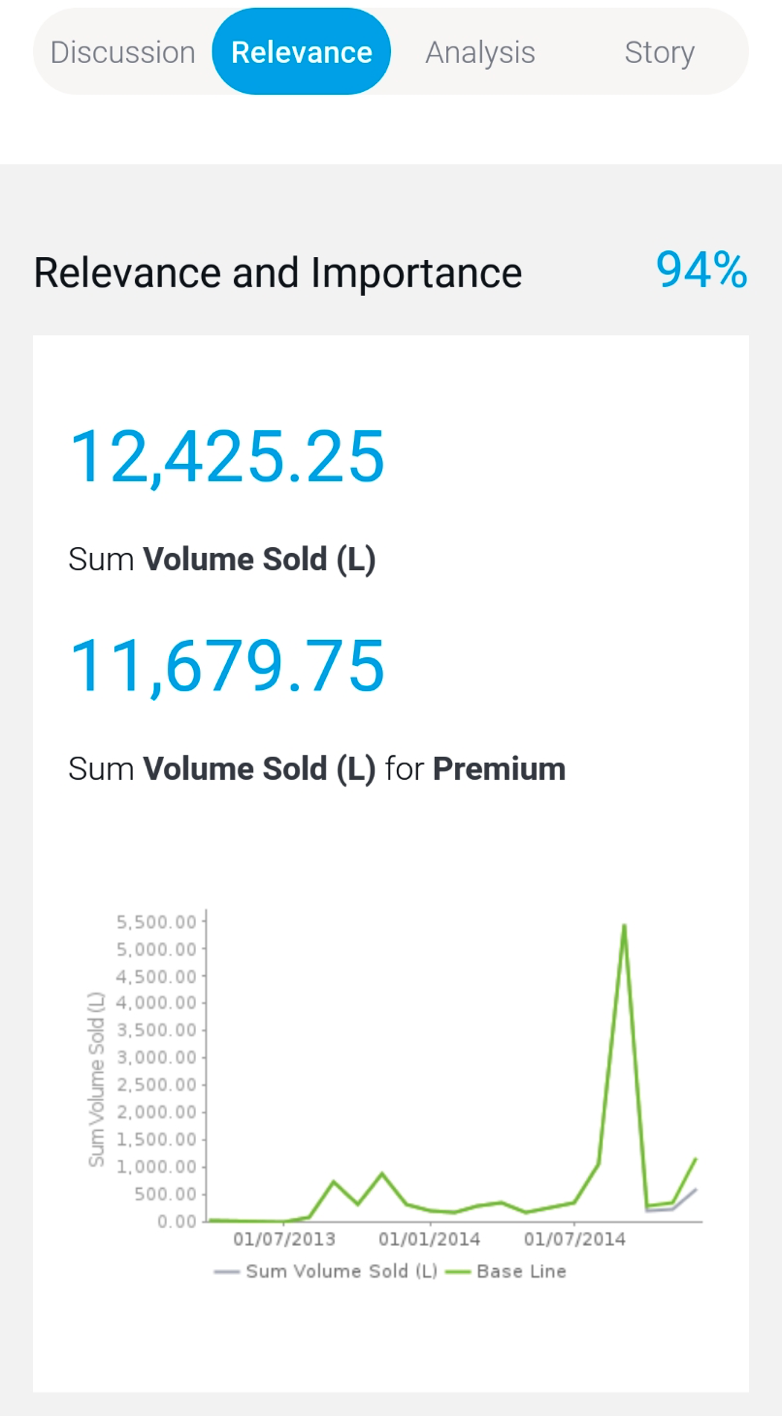
Signal
...
relevance
The chart in the Relevance section here tab depicts the importance of the Signals data a Signal (represented in grey) in relation to all other data that the user has access to (that is, the baseline data or access filters if applied, represented by green).
| Anchor | ||||
|---|---|---|---|---|
|
...
Signal analysis
The Analysis tab displays automated analysis through visualizations and natural language narratives, generated by Yellowfin’s Assisted Insights. It is used here to suggest the cause of a signalSignal, and provide underlying reasons for why it occurred.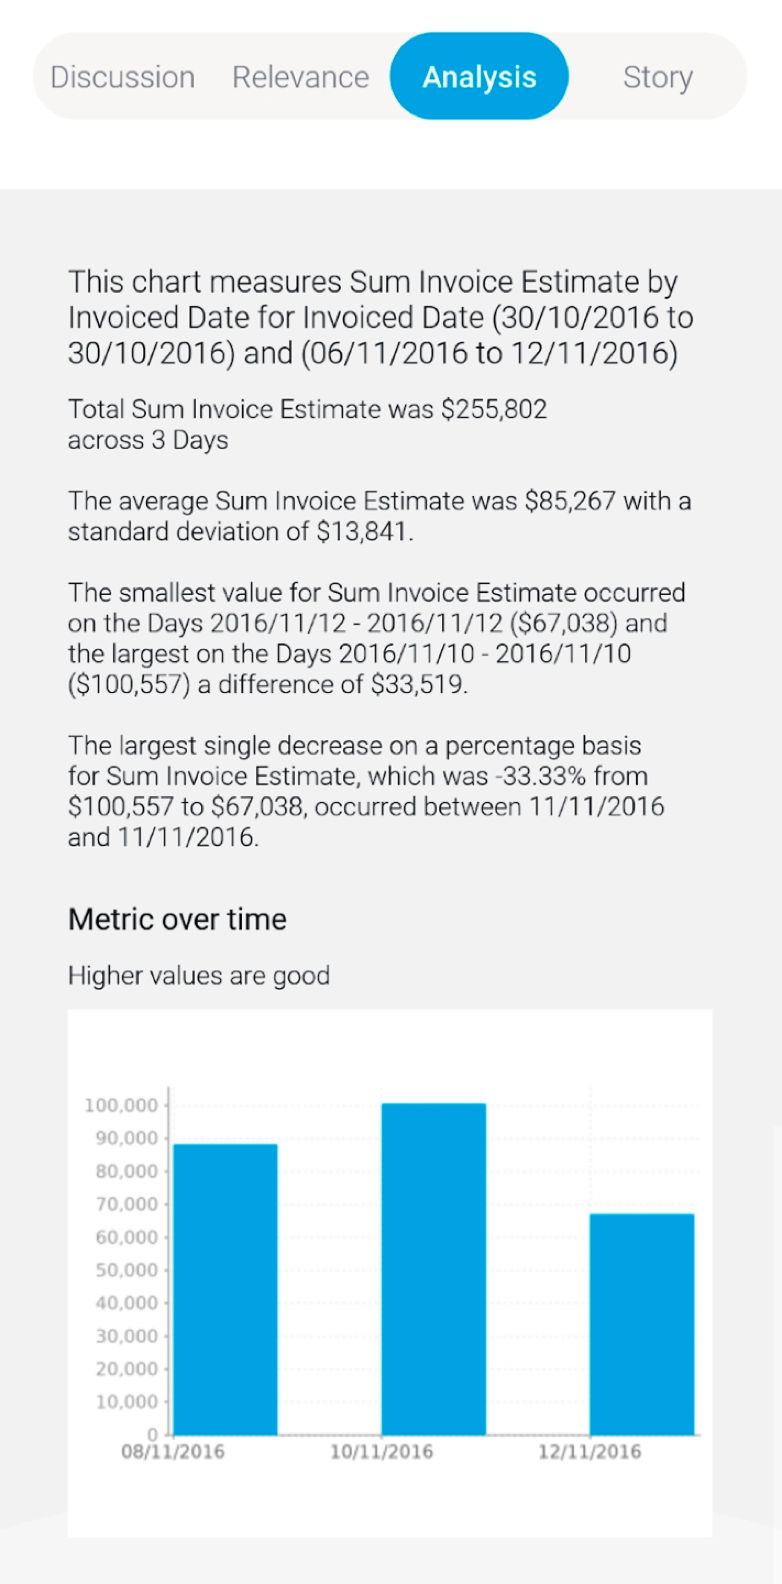
| Styleclass | ||
|---|---|---|
| ||