Overview
Time series do not necessarily have to be continuous. You also have the option to set your report data to be viewed according to distinct time junctures, such as a particular day, month or quarter, rather than viewing it as a continuous or progressive time flow (that is, from past to present/future). For example, rather than viewing your data from year 2005 to year 2016, you can now compare the results of specific months with one another. This way the combined result of all your March sales from 2005 to 2016 will form a single block on your chart.
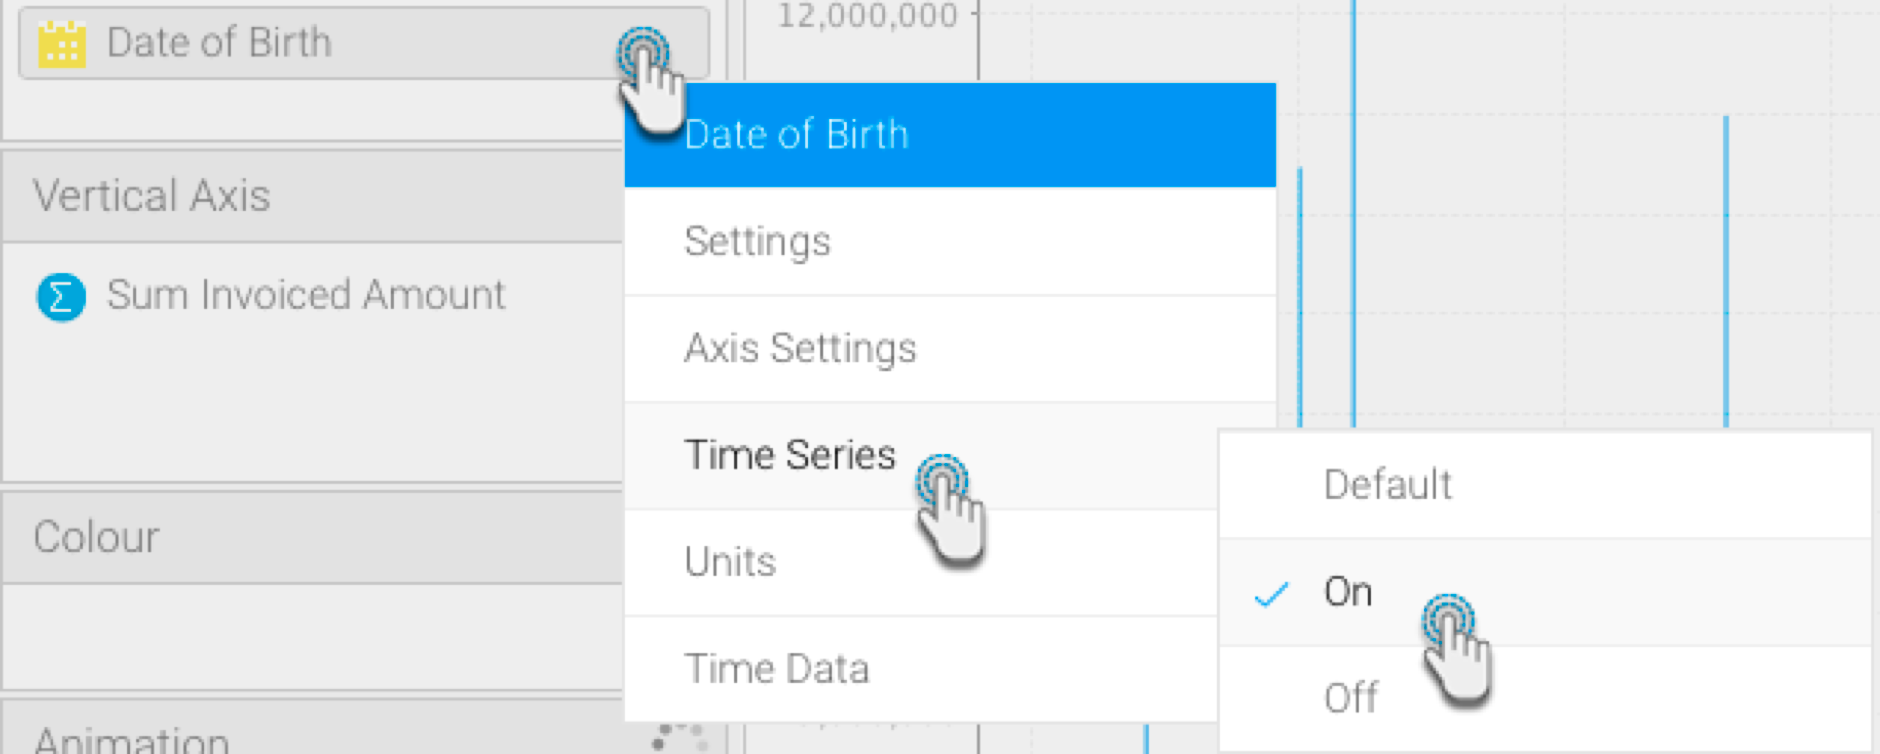
How to Use
Here’s how you can display a discrete time series in your charts.
Note: If you’re not using the Auto Charts feature, you will need to switch on the Time Series functionality, to enable the Discrete Time Data option.