Like what you see? Have a play with our trial version.

Error rendering macro 'rw-search'

null

You are viewing an old version of this page. View the current version.

Compare with Current View Page History

« Previous Version 14 Next »


You can use this section to manage your reports and charts using the dashboard.


Follow these steps to learn how to draw on a report or chart like on a whiteboard and email it.

  1. Open a report or chart
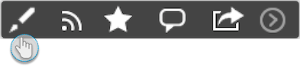
  2. Tap on the drawing icon to activate the whiteboard feature


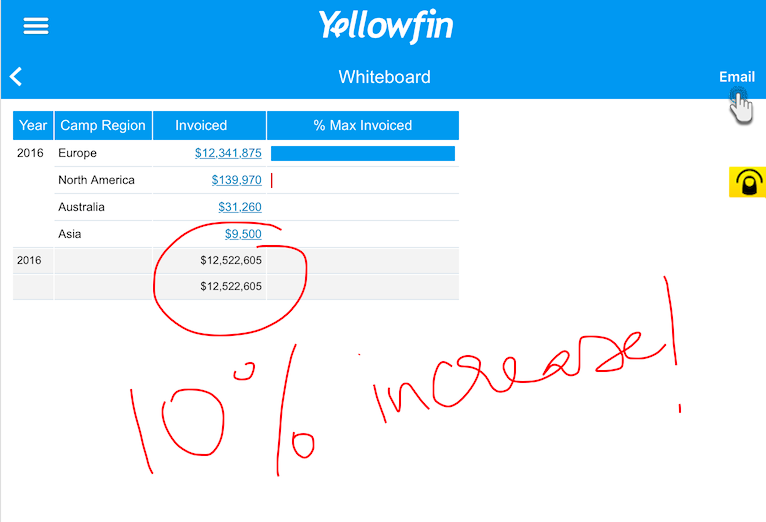
  3. Now you will be able to draw directly on the report
  4. You can then email this report screenshot by tapping on the Email option in the top-right corner of the screen


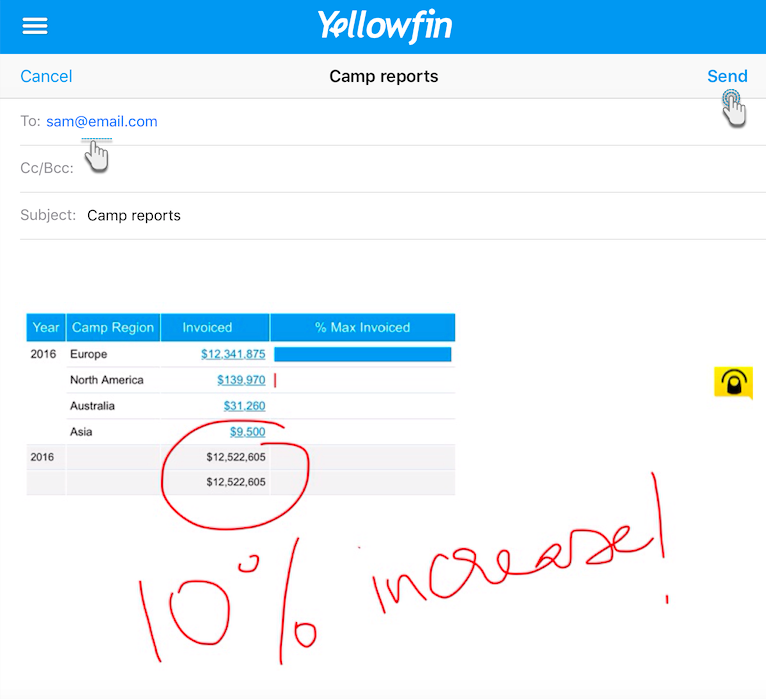
  5. In this next screen, provide the recipient's email and other details and then tap on Send


top


You can schedule your reports or charts to be broadcasted to specific users at a pre-defined time, as frequently as required.


  1. Open a report or chart
  2. Tap on the broadcast icon
  3. When the side panel expands, tap on the title field and provide a title for this broadcast

  4. You can also use the next field to provide a description
  5. Tap on the option to add a condition if you would like to include one. Conditions provide a unique way to set up a schedule, in that the broadcast will only be sent out if the condition(s) become true
    1. Create a condition by choosing a field from the report, an operand to applies to this field, and finally a value. For example, you could select the invoice field, choose the greater than option and set the value as 5000. So now your condition will become true if the invoice value surpasses the amount of $5000.
  6. Next, choose how to attach the report to the broadcast message by tapping on the HTML option and making a selection
  7. Schedule the frequency with which to repeat this broadcast. (E.g: If the broadcast is set to be sent weekly, then select a week day)
  8. You can also set up advanced scheduling options. Use the Advanced option to view additional scheduling options:
    • Choose a time zone for the broadcast schedule
    • Select the time at which to broadcast the report
  9. Tap on Save to schedule the broadcast
  10. Note: You will notice that the broadcast icon in the report options will have turned blue.


top 


Here's how you can mark a report as a favourite item to make it appear in the Favourite panel:
  1. Click on a report to access it.
  2. And simply tap on the favourite icon in the bottom-right corner
  3. Once favourited, this button will turn blue and the report will be added to the Favourite panel on the home page


    Tapping on a blue star button will unfavourite that report.


top


The most basic method to add a new comment to your report is explained below:

  1. Click on a report in the grid to access it
  2. Tap on the plus icon in the bottom-left corner; a range of other options will appear
  3. Now tap on the comment button to add a comment
  4. All the report comments will appear, provided there are any added
  5. You can perform the following additional tasks on these comments:
  6. Enter your comment in the pop-up that appears and tap on Ok to save it

    IconFeatureDescription
    New commentTap on this button on the top-left side of the comments panel to add a new comment to the report.
    ReplyUse this button to add a reply to a comment.
    InsightfulMark a comment as insightful by tapping on this comment.
    CheckTap on this button to check a comment.
    DeleteUse this to delete a comment.
    View repliesUse this button to view all the replies and responses made on a comment.
    Exit panelTap on this button on the top-right side of the comments panel to close it.


top


Carry out the steps below to share a report with other Yellowfin users:


  1. Click on a report in the grid to access it
  2. Tap on the plus icon in the bottom-left corner; a range of other options will appear
  3. Now tap on the share button to add a share this report with other users
  4. The following screen will appear

  5. Tap on Distribute to choose a distribution method
    1. If you selected Email, follow these additional steps:
    2. Enter a subject for the email
    3. Tap on the HTML option to choose how to attach the report to the email
  6. Next, click on the Add Recipients link to add users with whom you wish to share this report
  7. Then select individual Yellowfin users or groups and tap on Ok
  8. Returning back to the share screen, you can even include a message to share with the recipients
  9. Finally, tap on Ok


top 


Note: This feature will only be available if sorting can be applied. Drill through?


top 


top 


top 


top 


Here is how you can access report filters, provided that they are added by the creator of the report through Yellowfin's main system.


  1. Open a report
  2. Tap on the report menu on the top-left side of the screen
  3. Select Filters from the expanded menu. (Note: This option will only appear if there are any filters included in this report)
  4. A panel with filters will appear, as shown in the example below.

    These filters will differ according to what has been added to the filter field when the report was created in the main Yellowfin system.

  5. You can start applying these filters to your report.


top 


top 


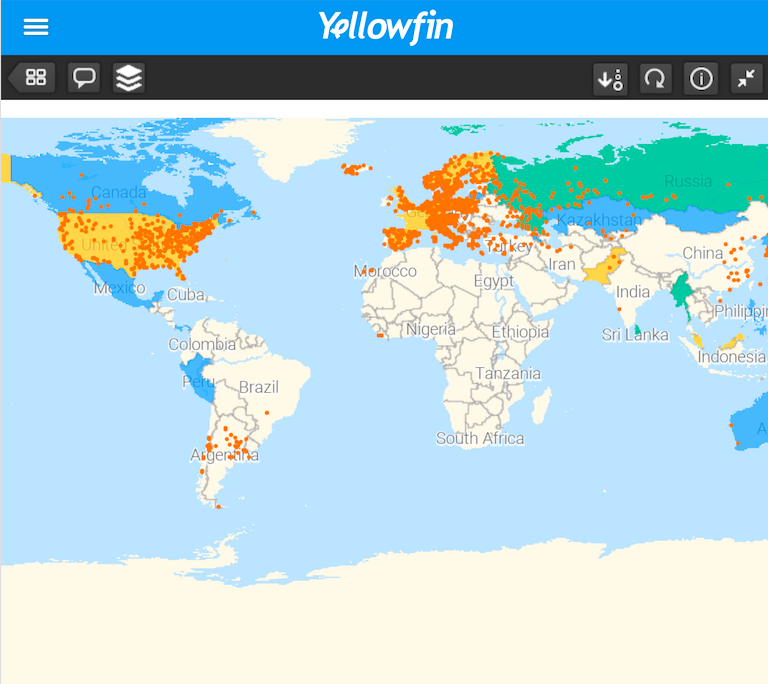
If your map has data layers, you can use a layer to view its data, as located on the map.

  1. Access a GIS map on your device
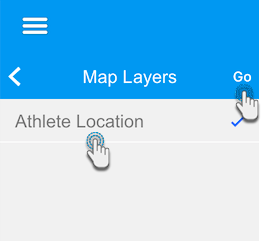
  2. Tap on the map layers icon on the top-left side


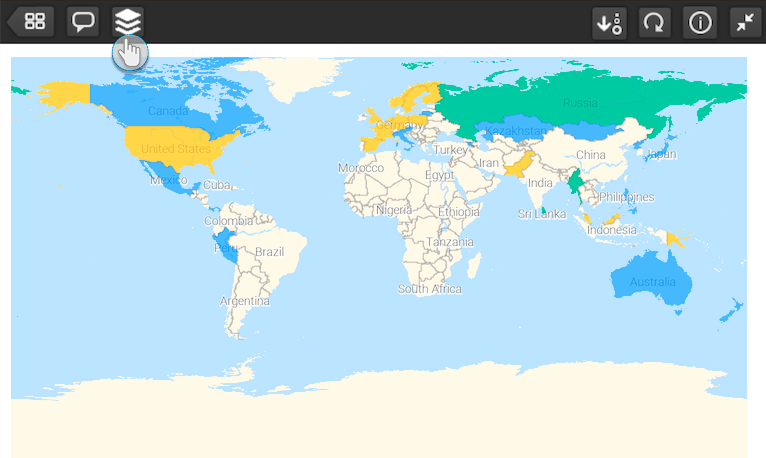
  3. When the side panel expands, choose a layer and then tap on Go


  4. You will be able to view the data records belonging to that layer on the map


top 


  • No labels