Overview
Function fields in the Chart Builder allow you to create a new field available to the chart, which is based on a report field with a selected function applied to it.Using Functions
When building a chart you can add a function one of two ways:
| Location | Screenshot | Description |
|---|---|---|
| Function List |  | You can drag a function from the function list on the left side of the chart builder screen. These fields will become available once required field components have been added to the chart. For example, some functions require a metric to be based on. |
| Field List | 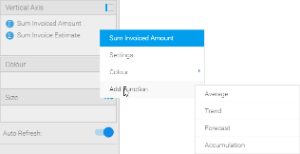 | You can add a function directly from the field you wish to base it on:
|
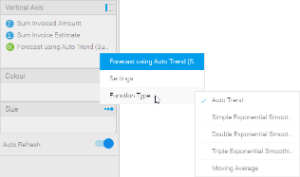
Selecting a Function
Once you have added a function to your chart, you can change the specific function being applied by clicking on the drop down menu on the field (hover the mouse over the field name).
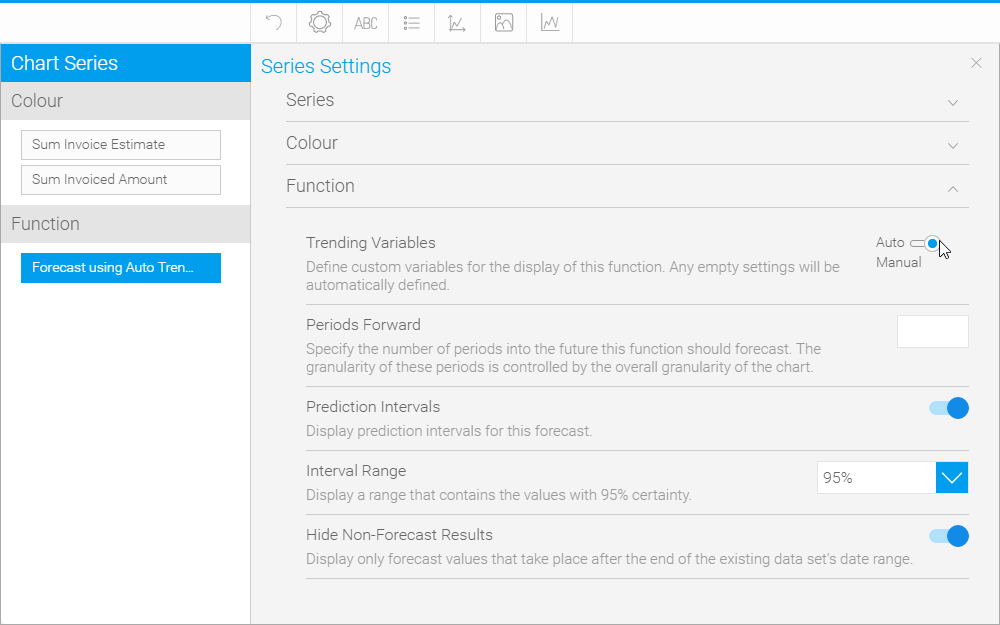
Function Options
Once you have selected the specific function you wish to use, you can manually configure all of the parameters for it through the Series menu.
Average
Mean
This displays a line calculated as the sum of all values, divided by the number of values in a dataset.
Median
This displays a line calculated by ordering all the values in ascending order and using the middle value. This can be a more useful measure than mean if the dataset has extreme outliers.
Mode
This displays a line calculated by finding the value which occurs most in the dataset.
Trend
Auto Trend
Much like with auto charts, Yellowfin applies what it deems most useful on the particular chart based on some complex algorithms.
| Option | Description |
|---|---|
| Confidence Intervals | These are used to indicate a range where unknown or missing values are likely to fall. |
| Interval Range (if confidence intervals used) | This specifies the certainty range of values to be displayed.
|
Moving Average
This displays the mean, calculated using values from a set numer of periods before each point. For example, if your dataset contains 10 periods, a moving average may be set to use 5 at a time. This can be used to follow changes in the data on a line hat is smoother than the actual values, making it useful when displaying trend for noisy (spikey) data.
| Option | Description |
|---|---|
| Periods | This specifies the number of periods the moving average will cover. A higher number of periods will result in a smoother, but less responsive trend line. |
| Missing Values | This specifies how missing data should be treated.
|
| Confidence Intervals | These are used to indicate a range where unknown or missing values are likely to fall. |
| Interval Range (if confidence intervals used) | This specifies the certainty range of values to be displayed.
|
Linear Regression
This displays a straight line that indicates the relationship between the values on the x & y axes. This can be useful to give an idea of the general trend of data.
| Option | Description |
|---|---|
| Confidence Intervals | These are used to indicate a range where unknown or missing values are likely to fall. |
| Interval Range (if confidence intervals used) | This specifies the certainty range of values to be displayed.
|
Polynomial Regression
This displays a curved line to the dataset which indicates the relationship between the values on the x & y axes. This can be used where the relationship between the values is not completely linear, for example if your trend has significant fluctuations through it.
| Option | Description |
|---|---|
| Order | This specifies how many terms will make up the polynomial for the functions. The higher the degree, the more tightly fitted the regression line. |
| Confidence Intervals | These are used to indicate a range where unknown or missing values are likely to fall. |
| Interval Range (if confidence intervals used) | This specifies the certainty range of values to be displayed.
|
Forecast
Auto Trend
Much like with auto charts, Yellowfin applies what it deems most useful on the particular chart based on some complex algorithms.
| Option | Description |
|---|---|
| Periods Forward | This specifies the number of periods into the future this function should forecast. The granularity of these periods is controlled by the overall granularity of the chart. |
| Prediction Intervals | These are used to indicate a range where the actual value is likely to fall. |
| Interval Range (if prediction intervals used) | This specifies the certainty range of values to be displayed.
|
| Hide Non-Forecast Results | This specifies if forecast should be dispalyed either for the whole dataset range OR only after the end of the dataset range. |
Simple Exponential Smoothing
This displays a forecast based on the average of previous values in the dataset, with weighting defined by alpha (recent vs. historic data). This is useful or forecasting data which has no general trend or seasonality.
| Option | Description |
|---|---|
| Alpha | This specifies how much weight is given to recent data vs. older data. This higher the alpha value, the more weight is given to recent data. |
| Periods Forward | This specifies the number of periods into the future this function should forecast. The granularity of these periods is controlled by the overall granularity of the chart. |
| Missing Values | This specifies how missing data should be treated. |
| Prediction Intervals | These are used to indicate a range where the actual value is likely to fall. |
| Interval Range (if prediction intervals used) | This specifies the certainty range of values to be displayed.
|
| Hide Non-Forecast Results | This specifies if forecast should be dispalyed either for the whole dataset range OR only after the end of the dataset range. |
Double Exponential Smoothing
This displays a forecast based on the average of previous values in the dataset, with weighting defined by alpha (recent vs. historic data) and beta (trend). This is useful for forecasting data which has a general trend, but no seasonality.
| Option | Description |
|---|---|
| Alpha | This specifies how much weight is given to recent data vs. older data. This higher the alpha value, the more weight is given to recent data. |
| Beta | This specifies how much weight is given to the trend of the data. The higher the beta value, the more weight is given to the data's trend. |
| Periods Forward | This specifies the number of periods into the future this function should forecast. The granularity of these periods is controlled by the overall granularity of the chart. |
| Missing Values | This specifies how missing data should be treated. |
| Prediction Intervals | These are used to indicate a range where the actual value is likely to fall. |
| Interval Range (if prediction intervals used) | This specifies the certainty range of values to be displayed.
|
| Hide Non-Forecast Results | This specifies if forecast should be dispalyed either for the whole dataset range OR only after the end of the dataset range. |
Triple Exponential Smoothing
This displays a forecast based on the average of previous values in the dataset, with weighting defined by alpha (recent vs. historic data), beta (trend), and gamma (seasonality). This is useful for forecasting data which has a general trend and varies seasonally. Triple exponential smoothing requires at least two years of data for its seasonality calculations.
| Option | Description |
|---|---|
| Alpha | This specifies how much weight is given to recent data vs. older data. This higher the alpha value, the more weight is given to recent data. |
| Beta | This specifies how much weight is given to the trend of the data. The higher the beta value, the more weight is given to the data's trend. |
| Gamma | This specifies how much weight is given to the seasonality (what happened in corresponding periods of previous years). The higher the gamma, the more weight is given to the data's seasonality. |
| Periods Forward | This specifies the number of periods into the future this function should forecast. The granularity of these periods is controlled by the overall granularity of the chart. |
| Missing Values | This specifies how missing data should be treated. |
| Prediction Intervals | These are used to indicate a range where the actual value is likely to fall. |
| Interval Range (if prediction intervals used) | This specifies the certainty range of values to be displayed.
|
| Hide Non-Forecast Results | This specifies if forecast should be dispalyed either for the whole dataset range OR only after the end of the dataset range. |
Moving Average
This displays the mean, calculated using values from a set number of periods before each point. For example, if your dataset contains 10 periods, a moving average may be set to use 5 at a time. This can be used to follow changes in the data on a line that is smoother than the actual values, making it useful when displaying trend for noisy (spikey) data.
| Option | Description |
|---|---|
| Periods | This specifies the number of periods the moving average will cover. A higher number of periods will result in a smoother, but less responsive trend line. |
| Periods Forward | This specifies the number of periods into the future this function should forecast. The granularity of these periods is controlled by the overall granularity of the chart. |
| Missing Values | This specifies how missing data should be treated. |
| Prediction Intervals | These are used to indicate a range where the actual value is likely to fall. |
| Interval Range (if prediction intervals used) | This specifies the certainty range of values to be displayed.
|
| Hide Non-Forecast Results | This specifies if forecast should be dispalyed either for the whole dataset range OR only after the end of the dataset range. |
Accumulation
This displays an accumulative % of total line on the chart, using a secondary axis.
Set Analysis
| Option | Description |
|---|---|
| Set Name | |
| Set Metric | |
| Filter |
Variance
| Option | Description |
|---|---|
| Variance Name | |
| Variance Between | |
| Display Variance as |