Overview
Use this guide to learn how to configure the Instant Insights settings through the view builder, in order to provide users access to the Instant Insights functionality.
- For existing dashboards and views, you will need to manually enable this functionality. This is done through the view’s setting page, since the chart data is based on views. However, for new views, this will be included as part of the view creation process.
- Ensure that the user configuring these settings has the security access to do so. Click here to learn about the related security functions.
Instant Insight discovery is only available for pre-selected fields. But, you can change these fields through the view settings screen.
Set Up Procedure
First, determine which view your chart is based on.
You can do this by accessing a chart, and then clicking on the information button.
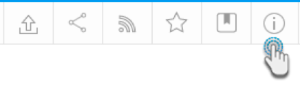
Click on it to view all types of details on the report, including the view name.
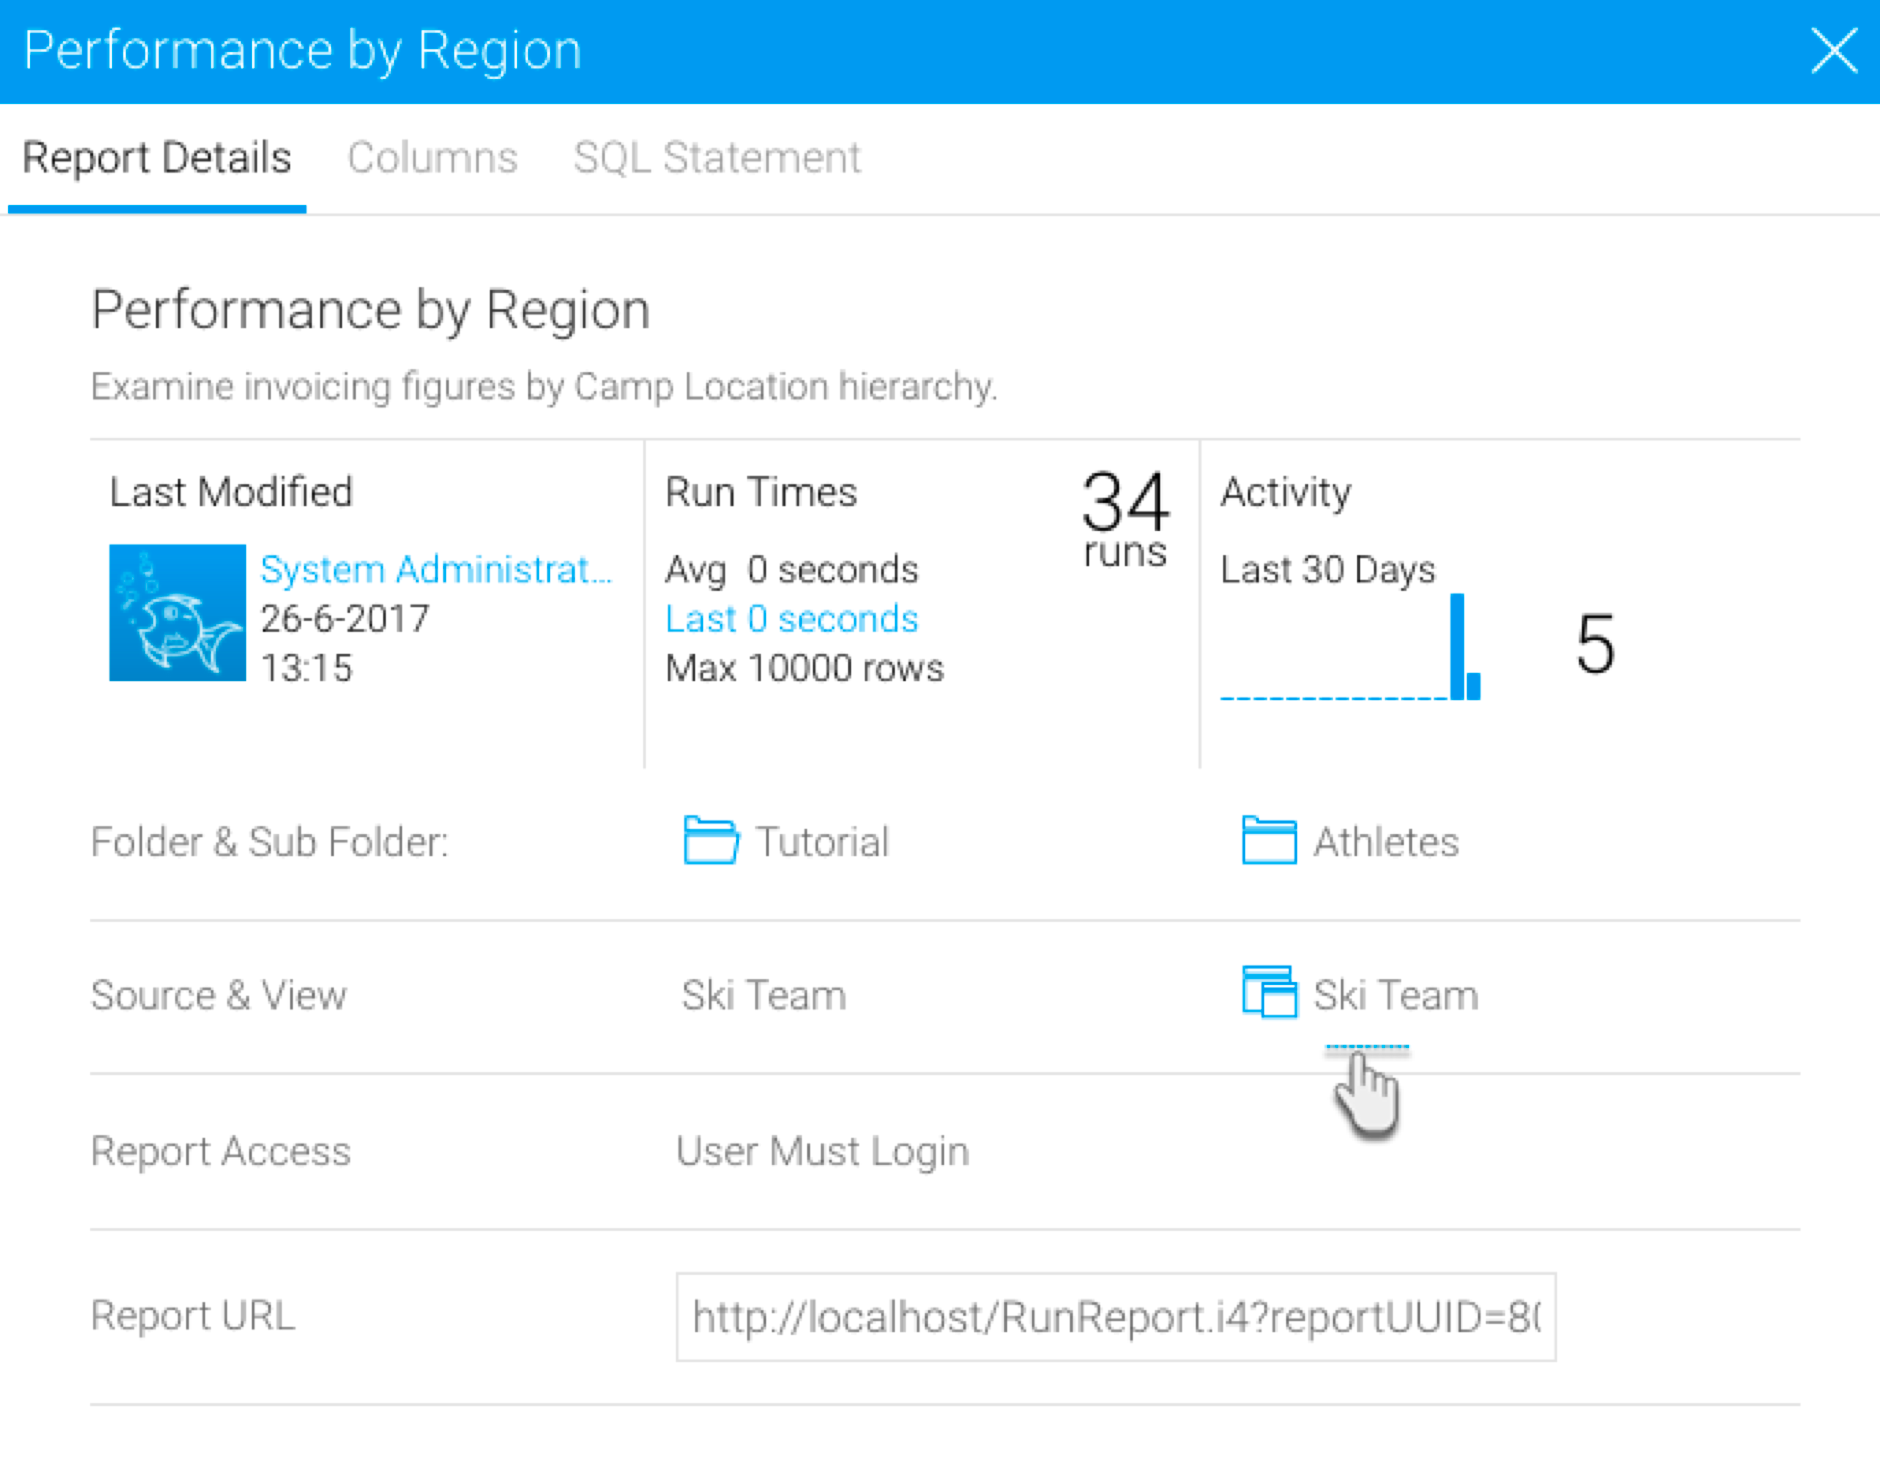
Then navigate to the views screen. (Main menu>Browse>Views)
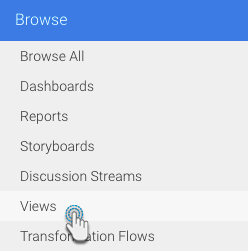
In the view screen, on finding the view you want, access it menu (through the button in its bottom-right corner) and then choose Edit.
Click Ok on the confirmation box.
Choose an option to edit the view.
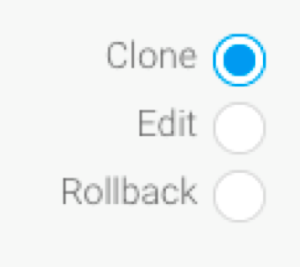
Then click on the button at the bottom.
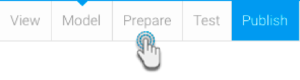
Next, navigate to the Prepare section from the view’s model screen.
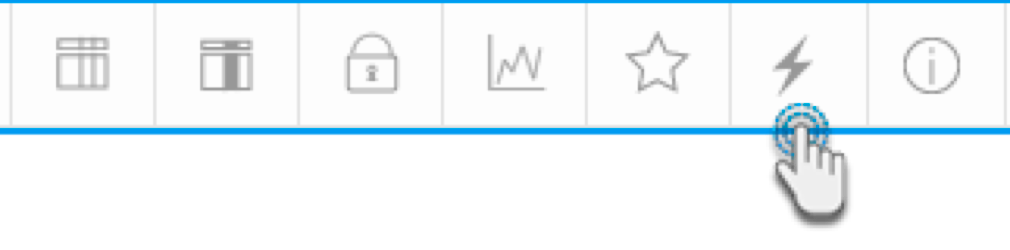
Click on the Instant Insights set up button, from the header menu options.
This button will only appear if you have the role function for Instant Insights Setup. Click here to learn more about this.
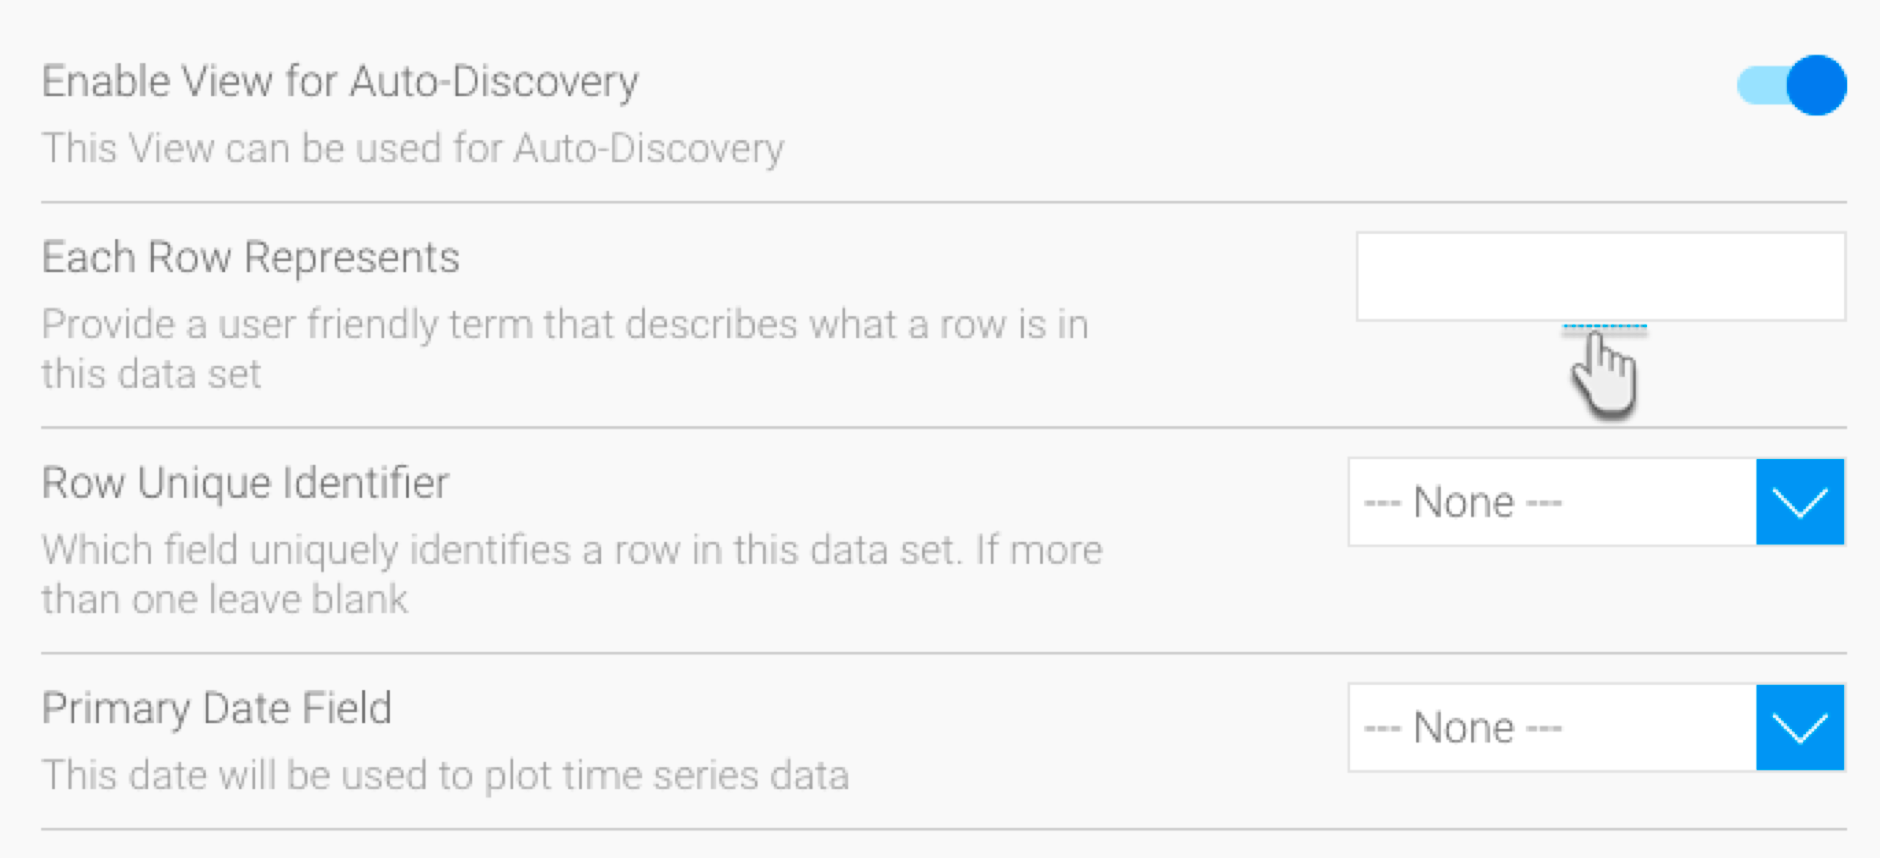
Now, click on the button to enable your selected view for auto-discovery.
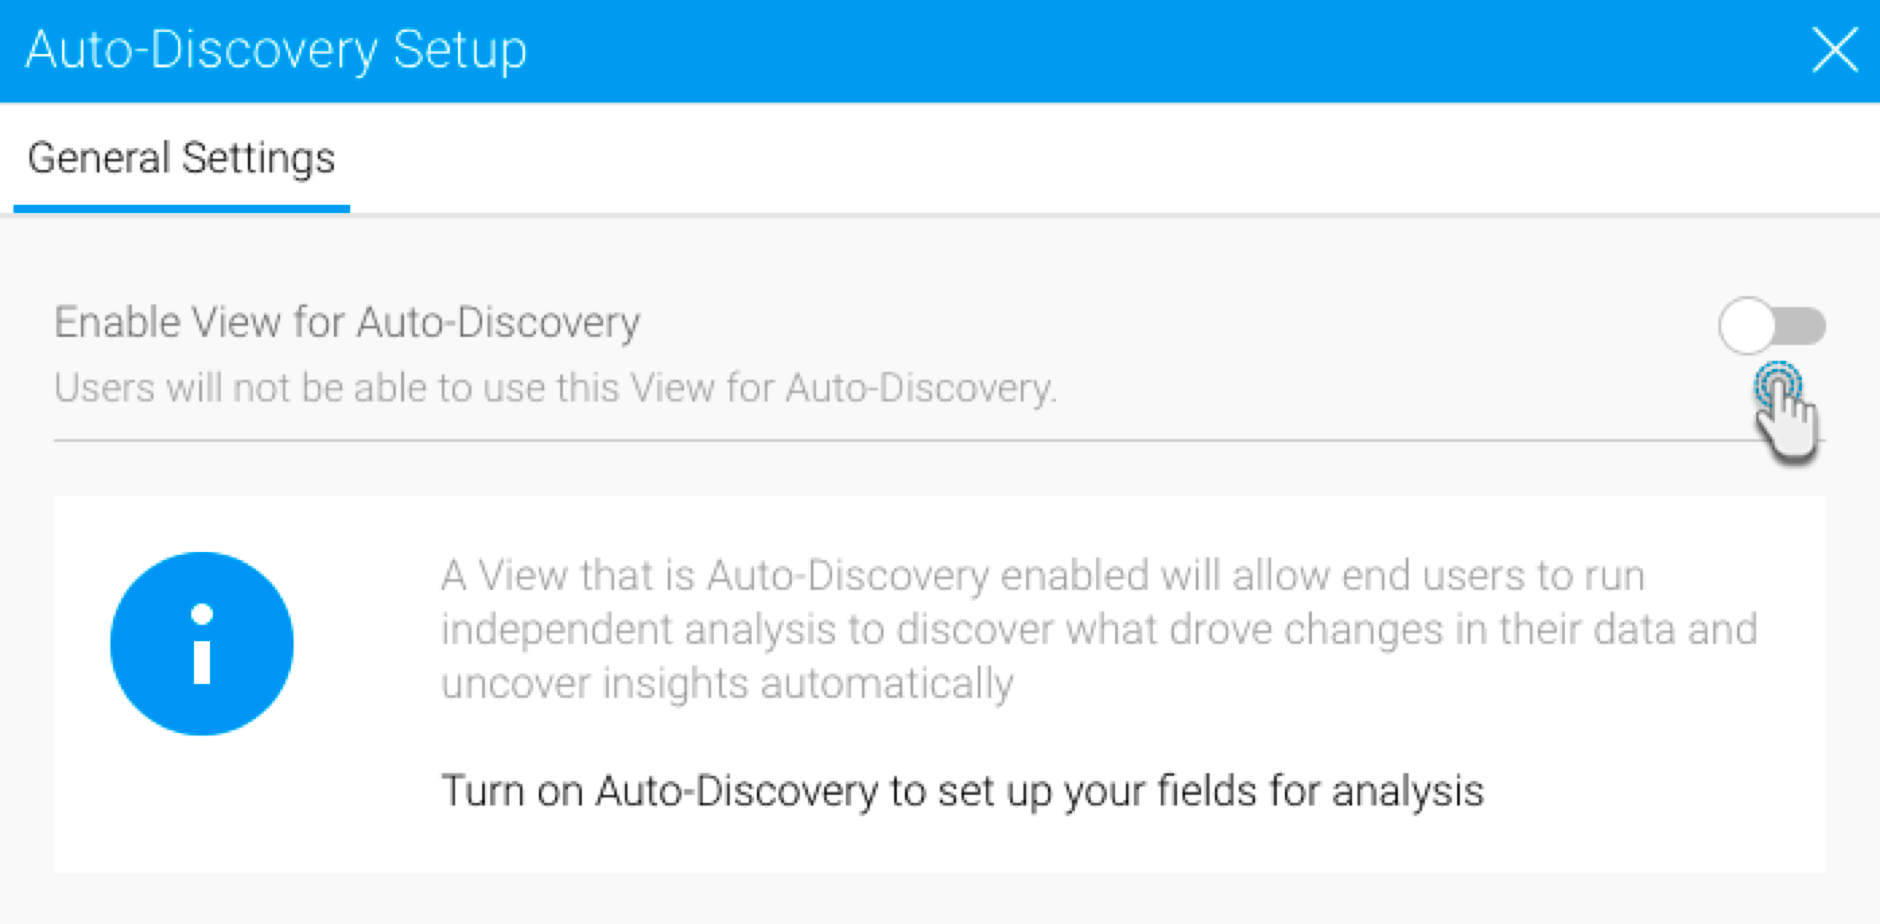
You will now notice additional fields and tabs appearing on this setup screen.
Enter a term in the row representation textbox.
Click on the Key Variables tab to select the metric and dimension fields you want the auto-analysis feature enabled for.
Then select checkboxes for all those fields.
Only data fields selected here will have the Auto Analyse option appear in the tooltips.
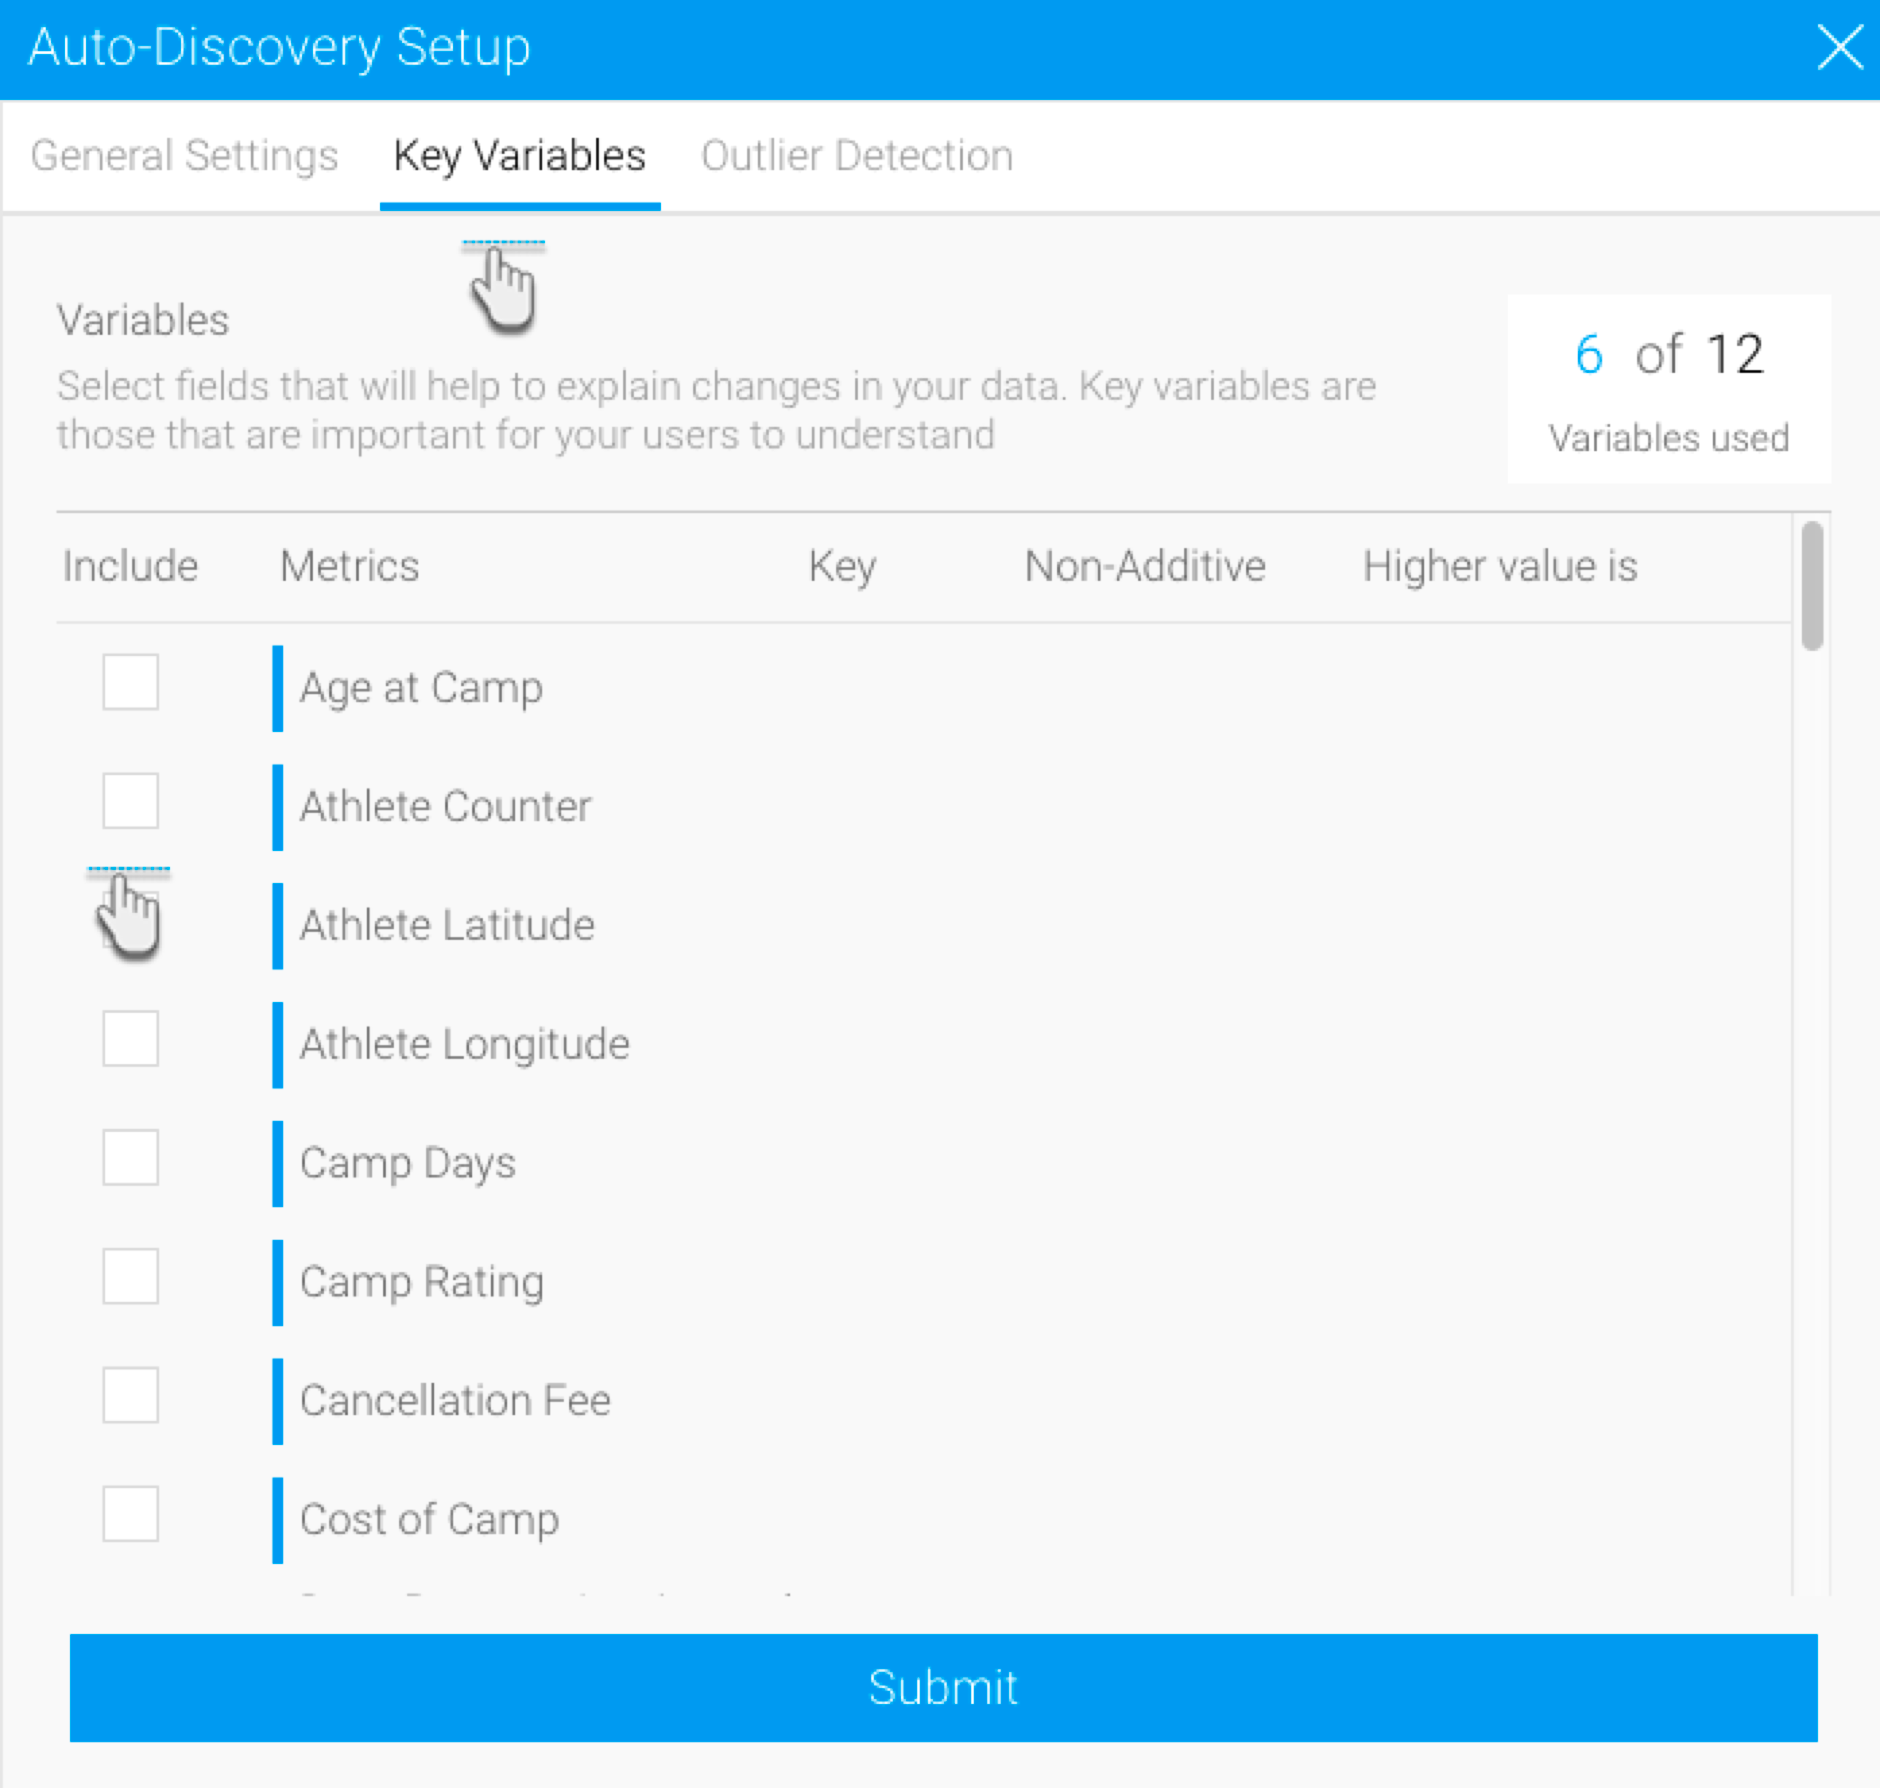
Click on Submit, after including your preferred fields.
Back at the prepare page, save these view changes by clicking on the Publish button, choosing the folders and clicking on the Save and Publish button.
You will now be able to use the Instant Insights feature on your charts.