Overview
Brushing allows users to restrict results in their chart by choosing to Include or Exclude certain areas. This is a far more interactive method of filtering, as the user defines what they want to see or remove by highlighting the particular area on their chart.
Include
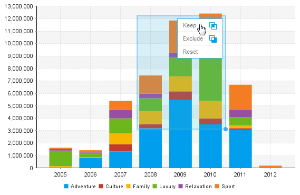
Once the chart has been created, you are able to restrict results to the ones you select by:- Click and drag to highlight an area on the chart
- Select the Keep option
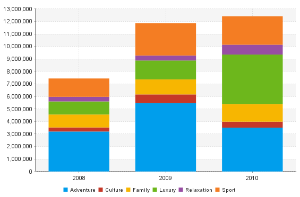
- You will now notice that the chart has been restricted to only the values you selected in the highlighted range
Exclude
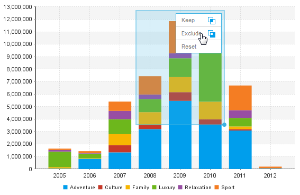
Once the chart has been created, you are able to remove results that you select from the chart by:- Click and drag to highlight an area on the chart
- Select the Exclude option
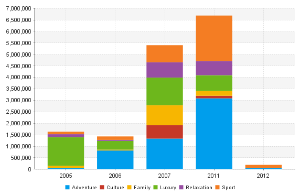
- You will now notice that the chart has removed the values you selected in the highlighted range
Reset
Once the chart has been brushed, you are able to reset results by:- Click and drag to highlight an area on the chart
- Select the Reset option

- You will now notice that the chart has been returned to its original state
Incompatible Charts
Brushing is not available on all chart types. The following are incompatible:- Histogram
- Z Chart
- Maps
- Meters
- Waterfall
- Event
- Week Density
- Trellis (not compatible with exclude brushing)
- Auto Charts (not compatible with exclude brushing)
Note: chart brushing is not available when Drill Anywhere or Drill Through is enabled.
Limitations
Chart brushing will not be available in the following cases:
- The user has the Active Charts content setting option turned off.
- The chart is being repositioned on the design page.
- There is a time slider on the time series charts.
- There are analytic chart fields (Trend, Average, Accumulation, and Forecast) added to the chart.
- The chart is part of a multi-chart report.
- The chart is embedded in a separate location using the JS API.
- The chart is being edited in the Chart Builder.