Adding Fields
To include a field in your table simply drag the field from the View Fields List, on the left of the page, to the Columns and/or Rows lists.- Locate the field(s) you wish to use either by;
- Keyword Search at the top of the View Fields List
- Opening the field category(s) they are located in
- Select the field by clicking on it. If you have multiple fields to add hold down the Ctrl/Command or Shift keys while selecting the fields.
- Drag the field(s) into the desired Column or Row list (see Layout Options below for more information on where to place your fields) or directly into the preview panel.
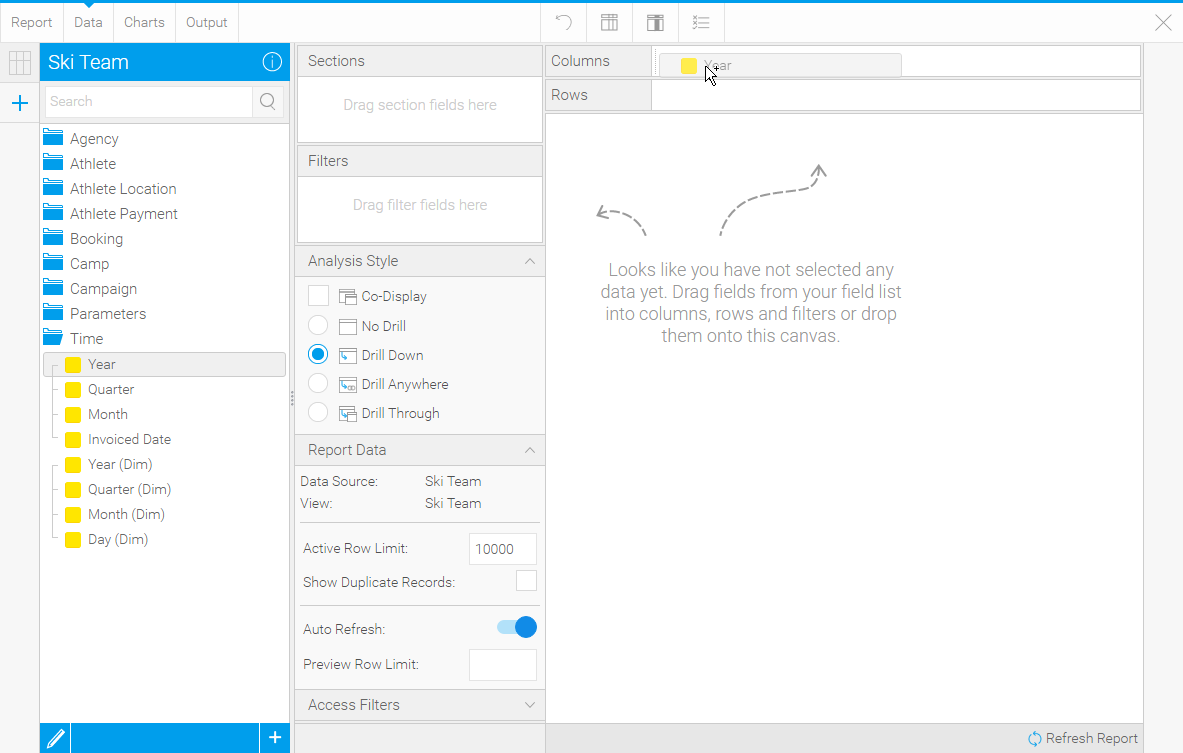
- You will now see a preview of the table. Continue adding fields as required.
Field Types
Icon | Type | Description |
|---|---|---|
| Dimension | These are typically text or date fields and are used to describe the data. |
| Metric | These are the numeric values to be measured in the report. For example, sales sum, customer count, event count, average age. |
| Property | Property details of the dimension fields. This appears when a connection to SAP BW's BEx layer is established. | |
| Pre-Defined Filter | These are fields defined in the view to be used as filters in the report with pre-defined values attached, saving the user time defining the same filters over multiple reports. |
| Filter Group | These are like the pre-defined filters above, but are sets of filters, some of which may be set to user prompt rather than having set values. |
| Parameter | These are fields used to capture a value from the user which is then passed through to calculated fields or filters in the report. |


Layout Options
There are three types of table layout available:Layout | Description |
|---|---|
Column | The most common form of table output, all fields added are displayed as a column in the table layout, with the field name used as the column header. |
Row | A variant the column layout, all fields added are displayed as a row in the table layout, with the field name used as the row header. |
Cross Tab | A special layout that allows you to summarise data by using both Column and Row headers with Metric fields making up the body of the table. This display is sometimes referred to as a Pivot. |
See Table Layouts for more information.
Data Validation
Data validation checks are made by Yellowfin to ensure you are building your report the way in which the administrator intended. You will be prompted if you have used fields and filters incorrectly with the following messages:
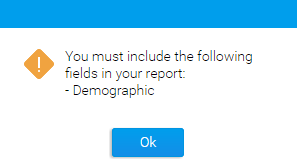
Mandatory
The fields shown in this type of message must be included into the field or filter section of the report. For example:
A variation of the mandatory field section validation is when a selected field in the table is being aggregated by sum or average. Constraints can be set when this occurs so that meaningful data is presented in the report. To proceed with your report you can remove the sum or average aggregation on the selected field or drag the relevant fields indicated in the validation message into the report.
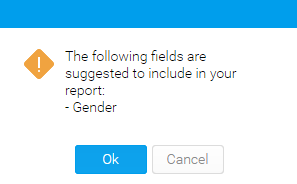
Suggested
When a suggested field or filter occurs, a messages box will appear with the suggestion. The user can chose to include this field or filter into the report or to ignore the suggestion.
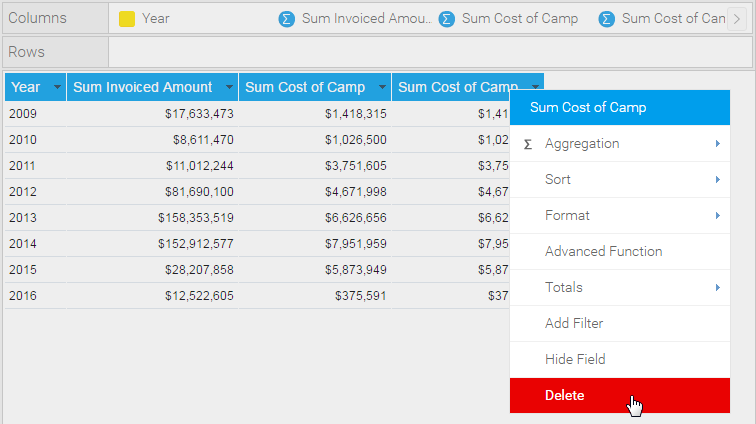
Removing Fields
There are two ways to remove a field from your table:- Select the field in the Columns/Rows list it's placed in, open the drop down menu and select Delete
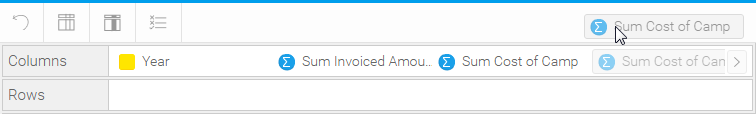
- Select the field in the Columns/Rows list it's placed in, and drag it to an area of the page that cannot contain a field (as pictured)
Reordering Fields
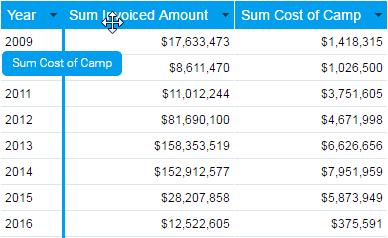
There are two ways to reorder fields in your table:- Select the field in the Columns/Rows list it's placed in, and drag it to its new position

- Select the field header in the Table Preview area, and drag it to its new position