How to Create JavaScript Charts
A JavaScript Chart is essentially made up of two components: JavaScript and CSS code. CSS is optional.
For the JavaScript portion, you could write your own or leverage an existing library. We ship with multiple different libraries which you can find in the /js/chartingLibraries/ folder. It is recommended that you add any extra libraries you need to this folder. Note that it is not technically necessary to always use a charting library, you can create anything you like using JavaScript and your report data.
When defining CSS rules, it is recommended that you give them unique names so that they don’t conflict with Yellowfin styling. For example, a good unique name is mycompanyname_chart_ textcolour
How the generateChart function works
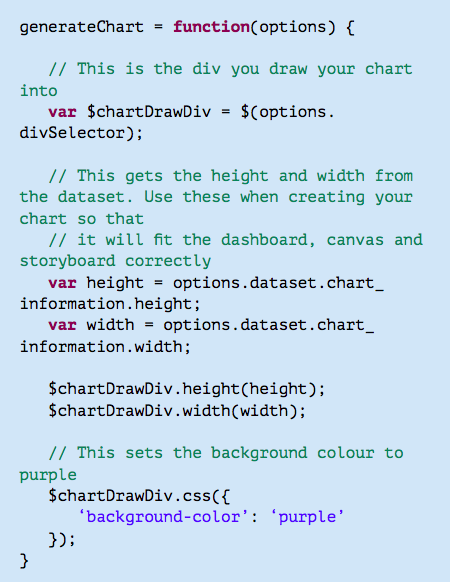
The only function required when creating a JavaScript Chart is generateChart. The other functions provided in the example code are recommendations. Yellowfin will call generateChart to execute your JavaScript code.
All the options and data that you need from Yellowfin will be sent as part of the Options JSON object to the generateChart function.
You will be drawing everything into a provided div (options. divSelector) which the dataset will give you the id for.
JavaScript Chart Example
This is an example of a very simple piece of JavaScript which will use the width and height sent in via the Options object and set the chart div to be purple.
Require and Shim
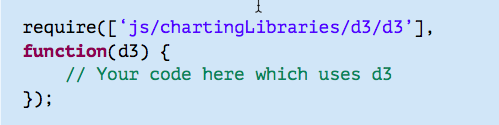
Use Require to load any libraries that you need for your JavaScript Chart. If you are planning to embed via Javascript API or publicly share the report, you will need to use absolute paths. Otherwise, relative paths will be fine.
To use Require, simply define the path of what you need to load as follows: