Embedding using Embed Links
Using an embed link is the simplest way to integrate Yellowfin content.
Obtaining an Embed Link
First and foremost, the content that you are wanting to embed must be already built in Yellowfin. Open the relevant Report or Dashboard and click on the Share option.
Share option on a report:
Share option on a dashboard:
![]()
Share popup with Embed link:
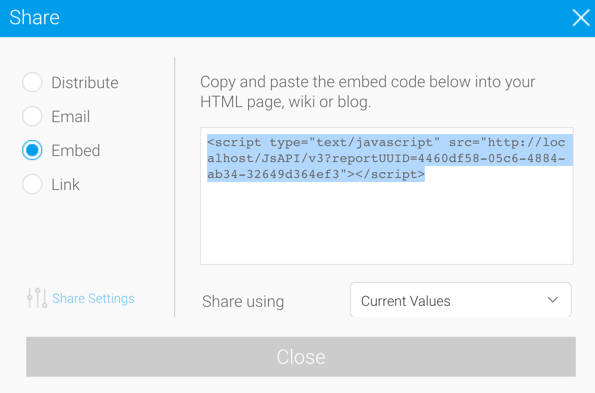
One of the types of Share available displays a script tag that looks like the following:
<script src=”http://localhost:8080/JsAPI/v3?reportUUID=2130913-asdsad8-21930123-asdads”></script>
Using the Embed Link on your page
Put this script tag into your HTML page:
<!DOCTYPE html> |
When the page is loaded, this will call all of the required code to display a report or dashboard on your page.
This content item will take up 100% of the space available to it. So if you embed it on a page with no styling it will take up 100% of the width of the browser and as much height required to render the chart of the table.
Embed Link Options
The embed link can have a number of options passed to it. These can be manually appended to the link after it has been obtained.
Reports
The following options are relevant when embedding a report.
The report’s charts and tables will size themselves to fit inside the container. A report canvas will not be scaled to render within the dimensions of the embedded report. If the defined size is smaller than the report canvas size, scrollbars will be added to the report element to allow you to see the entire canvas.
width
Used to set the width the report should render to. If no width is defined it will render to 100% of its parent element.
| &width=200 |
height
Used to set the height the report should render to, if no height is defined the report will render to 100% of its parent element.
| &height=200 |
showToolbar
Determines whether or not the toolbar above a report will be visible.
Default: true
Note: If this is set to false, showTitle, showInfo, showExport, showFilters, showShare, showDisplayToggle will also be treated as false, as they are all children of the toolbar.
When the property is not defined or set to true:
| &showToolbar=true |
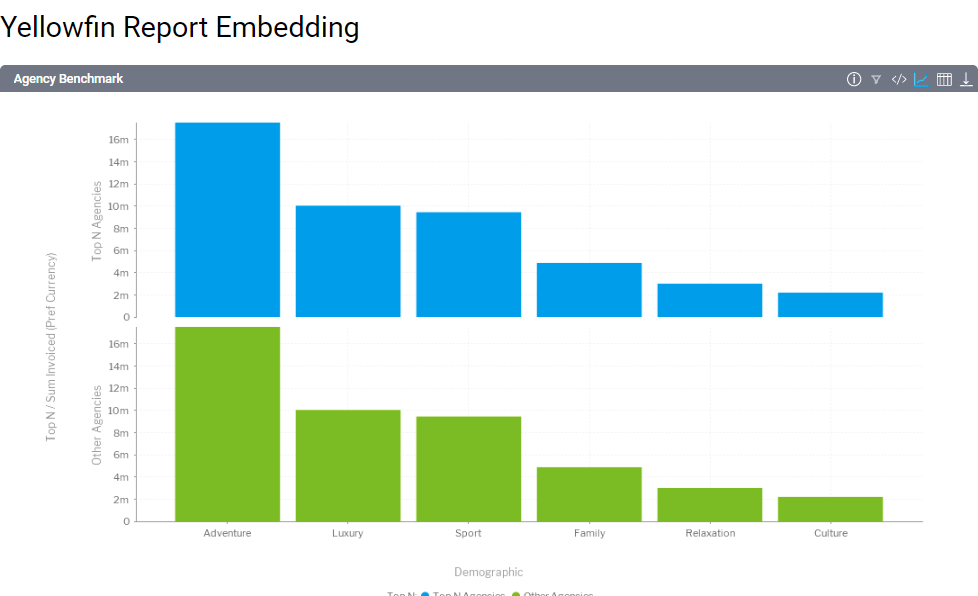
The toolbar will be displayed above the report, as shown in the example:
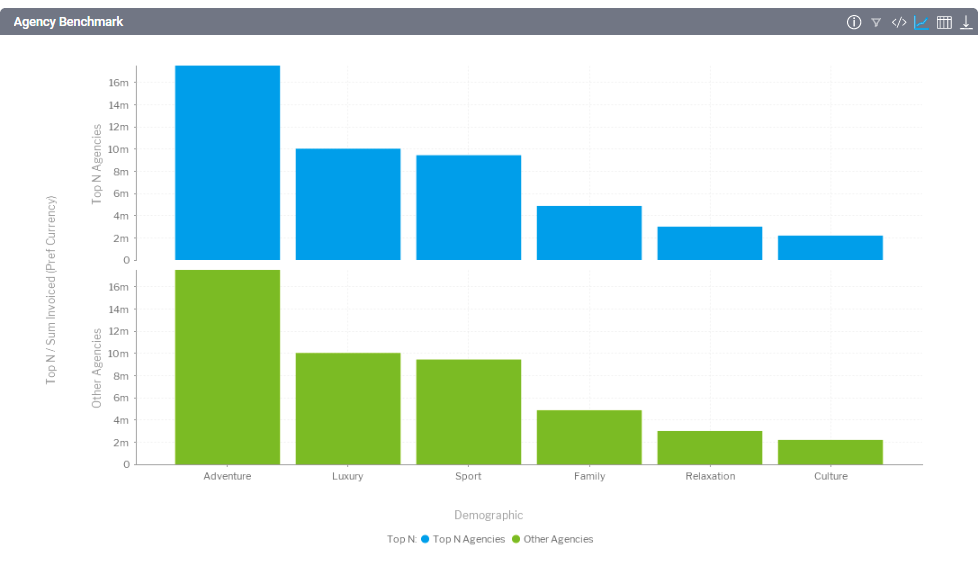
<script type="text/javascript" src="http://localhost:8080/JsAPI/v3?reportUUID=c83357db-8aef-4ec7-ab72-fce34de9ee77&showToolbar=true"></script> |
If the parameter is set to false there will be no toolbar displayed:
<script type="text/javascript" src="http://localhost:8080/JsAPI/v3?reportUUID=c83357db-8aef-4ec7-ab72-fce34de9ee77&showToolbar=false"></script> |
showTitle
Determines whether or not the report name will be shown in the toolbar.
If the parameter is set to false then no title will be displayed in the toolbar:
![]()
<script type="text/javascript" src="http://localhost:8080/JsAPI/v3?reportUUID=c83357db-8aef-4ec7-ab72-fce34de9ee77&showTitle=false"></script> |
Default: true
&showTitle=true &showTitle=false |
showInfo
Determines whether or not the info option will be shown in the toolbar. The info option contains information about the report or dashboard that has been embedded.
The following information will be included:
- Report Name
- Report Description
- Folder
- Sub Folder
- Last Modified Date
With the showInfo parameter is set to false, the 'i' icon ![]() in the toolbar will be removed:
in the toolbar will be removed:
![]()
<script type="text/javascript" src="http://localhost:8080/JsAPI/v3?reportUUID=c83357db-8aef-4ec7-ab72-fce34de9ee77&showInfo=false"></script> |
Default: true
&showInfo=true &showInfo=false |
showFilters
Determines whether the filter option will be displayed in the report toolbar. This can be used with the filter[filterUUID] parameters to set a specific set of values for your embed link and not allow users to change any values.
With the showFilters parameter set to false, the filters icon ![]() will be removed:
will be removed:
![]()
Default: true
&showFilters=true &showFilters=false |
showExport
Determines whether or not the export option will be displayed in the report toolbar. Export options allow a report to be exported to an external file format such as csv, xls, pdf, txt and doc.
With the showExport parameter set to false the export icon ![]() in the toolbar will be removed:
in the toolbar will be removed:
![]()
<script type="text/javascript" src="http://localhost:8080/JsAPI/v3?reportUUID=c83357db-8aef-4ec7-ab72-fce34de9ee77&showExport=false"></script> |
Default: true
&showExport=true &showExport=false |
showShare
Determines whether or not the share option will be displayed in the report toolbar. The Share option allows a user to access the embed link for this piece of embedded content.
With the showShare parameter set to false the share icon will be removed:
<script type="text/javascript" src="http://localhost:8080/JsAPI/v3?reportUUID=c83357db-8aef-4ec7-ab72-fce34de9ee77&showShare=false"></script> |
Default: true
&showShare=true &showShare=false |
showDisplayToggle
Determines whether or not the chart and table toggles will be displayed. This toggle enables a user to change the view of an embedded report between the tabular report view and the chart view. If there is more than one chart associated with the report, then the report canvas is shown.
When showDisplayToggle is set to false the table and chart icons ![]() will be removed from the toolbar:
will be removed from the toolbar:
![]()
<script type="text/javascript" src="http://localhost:8080/JsAPI/v3?reportUUID=c83357db-8aef-4ec7-ab72-fce34de9ee77&showDisplayToggle=false"></script> |
Note: If the report has no chart then this option will have no effect.
Default: true
&showDisplayToggle=true &showDisplayToggle=false |
filter[filterUUID]
This can be used to set the values of individual filters on a report. The filter is identified by its UUID - "TheFilterUUID".
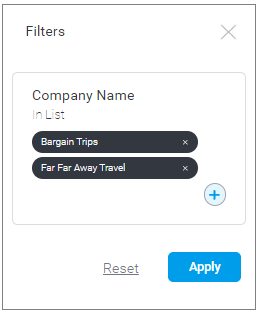
For example, you apply the values “Bargain Trips” and “Far Far Away Travel” to the filter “Company Name” which has the UUID “3aaf0e4-4b67-4118-9871-7dc98933e4e3”.
When retrieving the embed link through the Yellowfin UI, if there are filters applied to the report you are using, when opening the share menu the filter[filterUUID] values should already be populated.

<script type="text/javascript" src="http://localhost:8080/JsAPI/v3?reportUUID=c83357db-8aef-4ec7-ab72-fce34de9ee77&filterd3aaf0e4-4b67-4118-9871-7dc98933e4e3=Bargain+Trips%7CFar+Far+Away+Travel"></script> |
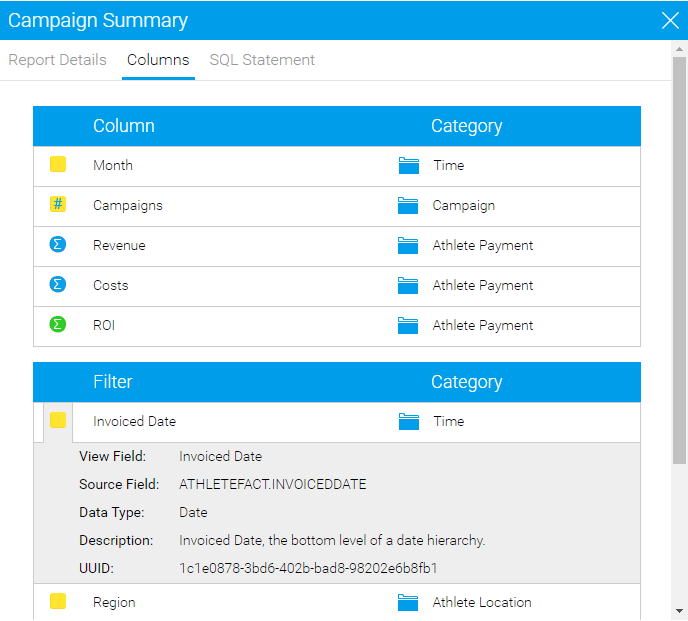
You can also retrieve the filter UUIDs by going to the Report Info popup and going to the columns tab.
| &filter[yourFilterUUID]=value |
If the filter is an "in list" or "not in list" you can separate values by pipes:
&filterTheFilterUUID=value1|value2|value3 |
If the filter you are trying to set is a between filter:
| &filter[yourFilterUUID]=value1|value2 |
Dashboards
The following options are relevant when embedding a dashboard:
When embedding a dashboard, the reports and canvas content within the dashboard will be scaled to the size of the container that it is embedded into. The content within the canvas will be scaled to match appropriately. Aspect ratio will be maintained when this scaling is applied.
The global content containers on a dashboard will be hidden by default when embedding a dashboard. Any filters that are within the dashboard will be added to the filter list that is location within the toolbar.
scaleCanvasTabs
Determines whether or not a canvas tab should be scaled. If this is set to false then the canvas tab will appear at the exact size it was created. This setting has no effect on sub-tabs which don’t contain canvas tabs.
Default: true
&scaleCanvasTabs=false &scaleCanvasTabs=true |