Report API
The Report API controls the state of the report. It contains information about the current state of the report, including the current drill state, sort criteria, filter values and other report interactions that may have been applied.
The Report API also controls the actual running of the report and will submit any of the interactions to the Yellowfin server when the report is run. The API also triggers a number of events when actions on the report are taken, either by a user action or an automated developer action.
Default Chart ID & Chart IDs
A report can have a number of charts; each of those charts will have a chartId and chartUUID. The chartId will change when a report is edited and published again, whereas the chartUUID will always remain the same. All functions that require a chartId can accept a chartUUID as well, however it is preferred to use chartUUID on any function that requires a chartId to be passed as it will never change.
There is also a “Default Chart” which will be the first usable chart on the report. A usable chart is one that has fields assigned to it. When a function requiring a chartId has no chartId passed to it, the default chart would be used.
You can access all the charts on a report using the charts property.
Field IDs
A report will have a number of fields; each of these fields will have a unique ID within the context of that report. This ID will never change, even when the report is edited. There is a function that allows you to retrieve the fieldId based on the field’s name, getFieldId(fieldName). Most functions that accept a fieldId will also be able to accept a field name and will attempt to find the fieldId based on the passed name.
You can access all of the fields on a report using the fields property.
Drill
When Drill Anywhere or Drill Down is applied to a field the process is as follows:
- Apply the drill value as a hidden filter.
- Replace the field we were drilling down on with the field we are drilling to.
- Run the query with the new field and filter.
Using a very simple drill example, consider a report that just has one column: “Agency Type”. In the Ski Team view (bundled with the Tutorial content in Yellowfin); “Agency Type” has a Drill Hierarchy setup with “Agency Name” as its child. When drill down is applied to the “Agency Type” field the report logic knows to drill down to the ‘Agency Name” field.
When the report is first run the SQL will look like this:
SELECT DISTINCT |
After drill down is applied on ‘Agency’ value you can see that Agency Type has been replaced in the SQL and the Agency Type filter has also been added.
SELECT DISTINCT |
Drill Anywhere works the same way, except it doesn’t have a predefined “drill to” field and the user (or developer if using an API call) defines which field they need to drill to.
Property Reference
name
Returns
String
Description
Returns the report’s name. This will be translated into the user's’ language if translations are enabled and a translation has been provided for that language.
reportUUID
Returns
String
Description
Returns the UUID of the report.
entityUUID
Returns
String
Description
The Unique Identifier for this instance of the report. This will be defined when the report is included on a Dashboard. Otherwise this will be null.
filters
Returns
Description
Returns the FiltersAPI for the Report. If this report is included on a dashboard, the FiltersAPI will be the same as the Dashboard’s FiltersAPI.
fields
Returns
Array[ReportField]
Description
Returns an ordered Array of the report’s fields.
charts
Returns
Object{String, ReportChart}
Description
Returns an Object containing all of the ReportCharts on the Report, keyed by chart UUID.
reportKey
Returns
String
Description
A unique identifier for the report that is used to identify exactly which instance of a report object should be used. A number of events will contain this as part of the information.
Function Reference
getFieldId(fieldName)
Returns
Number
Description
Returns the field ID for the passed fieldName. Returns null if no matching field is found.
Example
Get the fieldId of the field “Invoiced”:
let fieldId = report.getFieldId('Invoiced'); |
getFieldName(fieldId)
Returns
String
Description
Returns the field name for the passed fieldId. If no matching field is found null will be returned.
Example
Log that a particular field was drill down on
report.addListener('drilldown', function(event) { |
getChartId(chartId)
Returns
Number
Description
Returns the internal chartId for the passed chart name or chart UUID. If chartId is passed, the report’s default chart ID will be returned. If no matching chart is found, null will be returned.
applySeriesSelection(series, chartId)
Returns
Nothing
Description
Applies series selection to the passed chartId. Series Selection works by either replacing the series field on a chart with another field or adding multiple series fields to the chart to be rendered together.
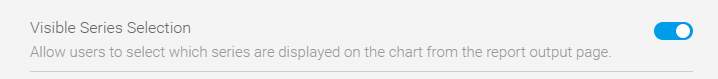
The option Visible Series Selection is required to be turned on at the chart level for this function to have any effect on the report. See Image below:
If the option Series Selection Style is set to “Top Panel” or “Left Panel” (as shown below), the chart’s series selection becomes a single selection type. Meaning only a single series can be selected at a time. When this option is enabled, the chart will only take the first value out of the passed array.
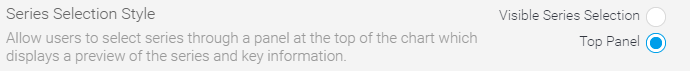
If the property is set to “Visible Series Selection”, the type of chart will determine whether all of the values are used or not.
If a fieldId that is not present on the chart or report is passed to the applySeriesSelection function, that fieldId will be ignored and the chart will be set back its default series value.
Parameters
Series - Array[Number]
Array of FieldId’s that you wish to apply to the report.
chartId - String, Number
The chartId that you want to apply the series selection to. If no chartId is passed the default chart ID will be used.
Example
Add a number of fields to the default charts series selection:
let fieldsToAdd = ['Invoiced', 'Cost', 'Profit']; |
Apply using a field ID:
report.applySeriesSelection(5); |
Apply using a field name:
report.applySeriesSelection('Invoiced'); |
sortAscending(fieldId)
Returns
Nothing
Description
Applies ascending sorting to the passed field. If the passed fieldId doesn’t match a field on the report, no sorting will be applied.
Parameters
fieldId: Number, String
FieldId or Name of the field that we wish to sort.
sortDescending(fieldId)
Returns
Nothing
Description
Applies a descending sort to the passed field. If the passed fieldId doesn’t match a field on the report, no sorting will be applied.
Parameters
fieldId: Number, String
FieldId or Name of the field that we wish to sort.
runReport()
Returns
Nothing
Description
Runs the report with the current state of the report applied. If the runReport function is triggered multiple times in a short period of time, the run report request will only be sent to the server once.
Example
Re-run the report every 5 seconds after the report finishes running.
//Add a listener for the reportComplete event |
registerOutputType(outputOptions, callback)
Returns
Number
Description
Registers a report output type to the report, which allows developers to get extra information from a report. Returns a unique identifier for the output you have just registered, this can be used to remove the outputType request from the report when you no longer need it.
The callback function for the output type will be called whenever the report has returned it’s data from the server, but before the reportComplete event is triggered.
From Yellowfin version 9.2 onwards, you can request the reports dataset as an output type.
dataset
Returns the dataset for the report.
Options
No options can be defined for this output type
Callback Parameters
dataset
A two dimensional array. Each item in the array will be an Object containing the following values:
- rawValue: The value as it would be when retrieving it from the database.
- formattedValue: The value after having any Ref Code or formatters applied to it.
- htmlFormattedValue: The value ready to be inserted into an HTML page.
For the field “Gender” which by default is formatted as a Ref Code, the data object would look like the following.
{ |
Differences between formattedValue and htmlFormattedValue
In a lot of cases you might not see any difference between the htmlFormattedValue and the formattedValue. There are some formatters which will output HTML tags which means that you can see differences there. In the following report example, the “Gender As Link” field is formatted using a “Link To URL” formatter which generates an anchor tag to be inserted into the table.

The dataset for the above row looks like this:
[{ |
Where the htmlFormattedValue contains the actual anchor tag and the formattedValue is what is displayed to the user.
Parameters
outputOptions: String, Object
Object or String with the information about the output type you wish to register. If a string is passed default options will be used for that particular output type will be used.
callback: Function
Function to call when the output type has completed. The parameters objects passed to this callback will vary depending on the output type that has been registered.
Example
Register a dataset output type and output the dataset:
report.registerOutputType('dataset', function(reportDataset) { |
Or register the dataset using the outputInformation object, these will achieve the same result:
report.registerOutputType({ resultType: 'dataset' }, function(reportDataset) { |
removeOutputType(outputKey)
Returns
Nothing
Description
De-registers the report output type and callback associated with the passed outputKey. This will stop the Yellowfin server from returning the information for that output request.
Parameters
outputKey: Number
The outputKey that you wish to de-register.
Example
Register a dataset type and then remove the output type from the report after it has completed once.
let outputId = report.registerOutputType('dataset', function(data) { |
reset()
Returns
Nothing
Description
Clears all of the report interactions (drill, sorting, time sliders, etc.) from a report and then runs the report. This will not reset the filters associated with the report as it is possible that the filters object will be linked to multiple reports, so resetting a filter specifically for this report can have an unintentional effect on another report. If you want to completely reset the report use this function together with filters.resetFiltersToDefault() or filters.clear().
Example
Add a reset button that can reset the reports interactions, but not filters:
let resetButton = document.querySelector('div#resetReportButton'); |
isDrillAnywhere()
Returns
Boolean
Description
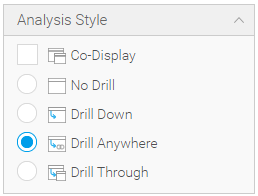
Returns whether or not the report has been defined as a 'Drill Anywhere' type report. This will be true if the “Analysis Style” option is set to “Drill Anywhere” during report creation.
isDrillDown()
Returns
Boolean
Description
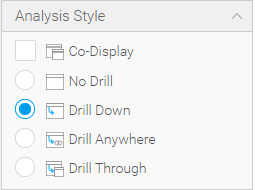
Returns whether or not the report has been defined as a 'Drill Down' type report. This will be true if the “Analysis Style” option is set to “Drill Down” during report creation.
isDrillDownApplied()
Returns
Boolean
Description
Returns whether or not the report has been drilled down. This will be true if any of the drill down fields on the report has been drilled down.
Example
console.log(report.isDrillDownApplied()); //Will return "false" as no drilling has been applied |
isDrillAnywhereApplied()
Returns
Boolean
Description
Returns whether or not the report has had drill anywhere applied to it.
drill(fieldId, value, toField)
Returns
Nothing
Description
Applies drilling to the passed fieldId, with the passed value.
For 'Drill Anywhere' reports toField will be used to determine the field to replace the fieldId field with. For a 'Drill Down' report the toField will be ignored as there is an internal hierarchy of drilling already defined at the view level.
If the drill is successful a “drilldown” or “drillanywhere” event will be triggered.
Parameters
fieldId: Number, String
The field that you wish to drill on.
value: Number, String
The value you wish to apply as the drill value.
toField: Number
View Field Template ID of the field that you wish to drill to. Will only be used on Drill Anywhere reports.
Examples
Drill down on the value “Agency” on the “Agency Type” field using a fieldId:
report.drill(1, 'Agency'); |
Or we can also use the field name as the fieldId parameter:
report.drill('Agency Type', 'Agency'); |
drillUpLevels(fieldId, levels)
Returns
Nothing
Description
Drills up levels for the passed fieldId. If the field you are drilling is at the top of its hierarchy already, no further action will be taken.
Using fields Camp Region -> Camp Country -> Camp Name as an example. If we are drilled down to the Camp Name level and call report.drillUpLevels(fieldId, 1); it will be returned to the Camp Country level.
If we called report.drillUpLevels(fieldId, 5); which is greater than the total drill hierarchy length (which is 3), this call would effectively reset the drilling on that field and return the fields drill to the Camp Region level.
Parameters
fieldId: Number, String
The field that you wish to drill up on.
levels: Number
The number of levels to drill up.
Example
Drill up a single level on a fieldId 1:
report.drillUpLevels(1, 1); |
drillUpOneLevel()
Returns
Nothing
Description
Drills up one level on all of the fields that are drillable in the report.
Example
Create a drill up button which drills the entire report up a level.
let drillUpButton = document.querySelector('div#drillUp'); |
drillReset(fieldId)
Returns
Nothing
Description
Resets the drill on the passed fieldId. If no fieldId is passed, the entire report's drill will be reset.
Parameters
fieldId: Number, String
The field that you wish to reset drill on.
Example
Reset the drill of the entire report:
report.drillReset(); |
Reset the drill of field 'Agency Region' by name:
report.drillReset('Agency Region'); |
Reset the drill of the field 'Agency Region' by fieldId:
report.drillReset(1); |
timeslider(from, to, chartId)
Returns
Nothing
Description
Applies the from and to values to the passed chart’s time slider. If no chartId is passed, then the report's default chart will be used. This will run the report to re-generate the chart with the applied time series values.
Parameters
from: Number
The time in milliseconds of the the lower bound of the time slider values.
to: Number
The time in milliseconds of the upper bound of the time slider values.
chartId: Number, String
ChartId that you wish to apply the time slider values to.
Example
Set the time slider to show dates between 'August 2014' and 'November 2014':
//Create the date objects for the days we care about and get their time values |
unitSelection(unit, chartId)
Returns
Nothing
Description
Applies time unit selection to the passed chart. If no chartId is passed, the report’s default chart will be used instead. The chart needs to have visible unit selection turned on for the option to have any effect.
Parameters
unit: String
The time granularity you wish to apply to the chart. The possible values are:
- MILLISECOND
- SECOND
- MINUTE
- HOUR
- DAY
- WEEK
- MONTH
- YEAR
Example
Apply unit selection of MONTH to the reports default chart
report.unitSelection(‘MONTH’); //No chart Id passed so the default chart will be used let chartUUID = ‘b779c293-a8ac-44cb-82f5-0c64da385333’; report.unitSelection(‘MONTH’, chartUUID ); //Apply with a specific chart uuid let chartName = ‘Chart One’; report.unitSelection(‘MONTH’, chartName); //Pass the chart name to determine which chart to use |
convertDrillDownToArray() & converDrillAnywhereToArray()
Returns
Array[Object]
Description
Returns an Array of the currently applied drill state on the report.
Each object in the Array will contain the following information:
- fieldId: Number indicating which drill hierarchy we have drilled on.
- reportId: The ID of the current report.
- reportKey: The report’s unique key.
- reportUUID: The report’s Publish UUID.
- templateId: The view level TemplateId of the field we are currently on.
- value: The value applied to this stage of the drill.
When iterating through the array, all drill objects on a field will be drilled sequentially in order. This means that if you have two fields that you can drill down on and they are both drilled, the first N values in the Array will be related to the first field, where N is how far that field has been drilled. The rest of the array would be made up of drill values for the second field.
On a report with the following drill structure:
Agency Region -> Agency Country
Camp Region -> Camp Country -> Camp Name
Agency Region can drill down one level. Camp Region can drill down two levels. When they are both fully drilled down the array would contain three entries. The first would relate to “Agency Region”, the second would related to “Camp Region” and the third would relate to “Camp Country” as that is the child of Camp Region.
Event Reference
All report events will be triggered with an object that contains the following properties:
- eventData: The data for the specific event. This will vary depending on the event that has been triggered. See each event to see what is included in the eventData object.
- metadata: An Object that contains some basic data about the report the event was triggered on, including:
- reportId: The Internal ReportId.
- reportUUID: The report’s UUID.
- reportKey: A unique identifier for this instance of the report.
- eventName: The name of the event that was actually triggered.
seriesSelection
Description
Triggered when series selection is applied to the report.
Parameters
eventData
- Series: (Array[Number] )Array of the field IDs that were applied for this series selection event. This should only contain fields that are actually on the report.
- chartId: The chartId the series selection was applied to.
sort
Description
Triggered when the report is sorted.
Parameters
eventData
- fieldId: The field that sorting was applied on.
- sortDirection: The direction that the field was sorted. Will be “ASCENDING” or “DESCENDING”.
reportStart
Description
Triggered when the report sends a request to the server to get a new dataset.
Parameters
No Event Data.
reportComplete
Description
Called after the report has returned from the server, and all of the callbacks that were registered in the registerOutputType function are resolved.
Parameters
eventData will contain a number of output results from the report run.
Example of Event Data:
{ //Example Empty Dataset |
drilldown
Description
Triggered whenever drill down is applied to any field on the report.
Parameters
eventData includes:
- fieldId: The field that was drilled on.
- added: (Array) Array of objects containing information about what values were applied.
- drillState: (Array) Array containing the entire drillState of the report. See convertDrillDownToArray.
drillanywhere
Description
Triggered whenever 'Drill Anywhere' is applied to any field on the report.
Parameters
eventData includes:
- added: (Array) Array of drill objects that have been added in this drill event.
- drillState: (Arra) Drill State of the entire report. See convertDrillAnywhereToArray.
drillUp
Description
Triggered whenever a report drills up. This will trigger for both 'Drill Anywhere' and 'Drill Down' reports.
Parameters
- removed: (Array) Array of drill objects that have been removed in this drill event.
- drillState: (Array) Drill State of the entire report. See convertDrillAnywhereToArray or convertDrillDownToArray.
resetDrill
Description
Triggered when the drill state for a field is reset or the entire reports drill state is reset. This will trigger for both Drill Anywhere and Drill Down reports.
Parameters
- removed: (Array) Array of drill objects that have been removed in this drill event.
- drillState: (Array) Drill State of the entire report. See convertDrillAnywhereToArray or convertDrillDownToArray.
reset
Description
Triggered when the reports reset function is called.
Parameters
No Event Data.
slider
Description
Triggered when a chart slider’s value is modified.
Parameters
eventData
- from: (Number) Lower bound of the slider values.
- To: (Number) Upper bound of the slider values.
- chartId: (Number) The chart which the slider was modified on.
unitSelection
Description
Triggered when a chart's 'Unit Selection' is changed.
Parameters
eventData
- unit: (String) The unit to be applied to the chart.
- chartId: (Number) The chart that the unit selection was applied to.