Overview
The first step in creating your chart is selecting the appropriate chart type to most effectively visualise your data. There are two methods for chart creation:
- Auto Chart
- Chart Selection
Auto Chart
The Auto Chart functionality provides some common component areas to be populated, and depending on what fields you drag into them, a chart will be generated.
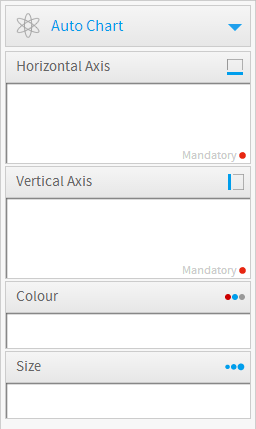
Note: auto charts generate common chart types such as; Bar, Column, Scatter, and Line. If you are looking for a specific chart or specialty chart it would be better to select the type from the Chart Selection panel on the right.
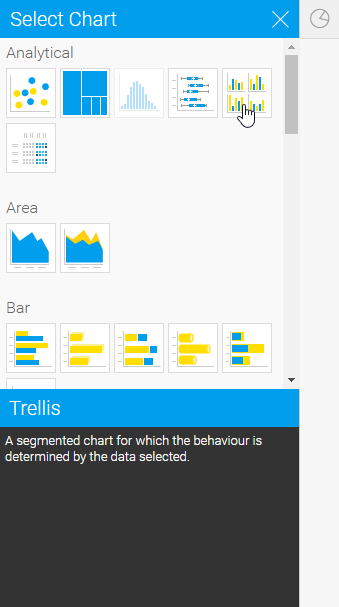
Chart Selection
The following list of chart choices will assist you to make you selection. After you have made a selection it is easy to swap between chart types to see how your data might look with different visualisations.
Icon | Type | When to Use |
|---|---|---|
| Scatter | A scatter plot (points not joined) chart that allows the charting of 2 related attribute series. Can only be used if the data series are related. Useful for seeing trends in data that is not linear. |
 | Treemap | Compares metric values via a size relationship. Can also be used to show hierarchical relationships. |
| Histogram | Shows the number of times a given value occurs in the dataset. |
| Box & Whisker | A chart which gives a quick overview of series of values and their statistical properties. |
| Trellis | A segmented chart for which the behaviour is determined by the data selected. |
| Heat Grid | Plots the intensity of a metric across multiple categories. |


See Analytical Charts for more information.
Icon | Type | When to Use |
|---|---|---|
| Area | You want to emphasize the magnitude of change over time. Use an area chart to show how much the value of a measure changes over time. |
| Stacked Area | You want to emphasise the magnitude of change over time, while comparing multiple categories. |


See Area Charts for more information.
Icon | Type | When to Use |
|---|---|---|
| Horizontal Bar | You want to highlight values for easy comparison and plot your numbers horizontally. Use a bar chart to place less emphasis on time and focus on comparing values. |
| 3D Horizontal Bar | Similar to the horizontal bar chart, but in three a dimensional form. |
| Stacked Horizontal Bar | Categorical data, grouped or stacked to assist comparison. Use when part-to-whole comparison is important. |
| Horizontal Cylinder | Similar to the horizontal bar, but having chart components shown in cylindrical form. |
| Proportional Bar | Displays how close values in different categories came to the highest category value. |


See Bar Charts for more information.
Icon | Type | When to Use |
|---|---|---|
| Vertical Column | You want to highlight values for easy comparison and plot your numbers vertically. Use a column chart to place less emphasis on time and focus on comparing values. |
| 3D Vertical Bar | Similar to the vertical bar chart, but in three dimensional form. |
| Stacked Vertical Bar | Also referred to as stacked column charts and used when part-to-whole comparison is important. |
| Cylinder | Similar to the vertical bar, but having chart components shown in cylindrical form. |
| 3D Stacked Vertical Bar | Similar to the 3d stacked vertical bar chart, but in three dimensional form. |
| Layered | Compares the contribution of each value to a total across categories. |


See Column Charts for more information.
Icon | Type | When to Use |
|---|---|---|
| Combination Charts | Combination charts, in effect, superimpose one chart type above or below another. Use to improve clarity and highlight relationships between data sets. |
| Overlay Chart | Use the line chart to emphasize a trend and bars to emphasize specific values. Line/Bar combinations may work better by de-emphasizing bars through the use of subtle colours. |


See Combination Charts for more information.
Icon | Type | When to Use |
|---|---|---|
| Financial Line | Use this chart to display a trading value with a subchart displaying volume. |
| High Low | Shows daily high, low, opening and closing values with tick positions corresponding to opening and closing values. |
| Candlestick | Shows daily high, low, opening and closing values with different colour bars depending on the daily direction. |


See Financial Charts for more information.
Icon | Type | When to Use |
|---|---|---|
| Line | You want to view trends over time by plotting data at points connected by lines. Use a line chart to plot many metrics. |
| 3D Line | Similar to the line chart, but in three-dimensional form. |
| Z Chart | Trends over a short period of time; displaying the data, accumulative total, and moving total. |
| Stepped Line | A line chart where movement is shown in steps rather than straight lines. |


See Line Charts for more information.
Type | Icon | When to Use |
|---|---|---|
| Image Maps | If you do not have GIS defined columns you can use the Image Maps to create heat maps – these are a good way to display metrics with a spatial element such as Revenue by State or Country |
| Google Maps | Google Maps allow you to render location data points onto a Google map which will be displayed as a Yellowfin Chart – along with associated Google map widgets. |
| GIS Google Maps | A Google map which uses GIS data for its marker coordinates. |
| GIS Maps | GIS Maps allow the rendering of complex GIS polygons. These can be used to render spatial reports on the fly based on the GIS data available in a report. |
| GIS Bubble Map | A bubble map in which bubble positions are specified by GIS points. |
| GIS Heat Map | A heat map where colours representing GIS points are blended based on intensity. |


Type | Icon | When to Use |
|---|---|---|
| Meter | You want to measure the rate of change of a measure against pre-defined targets. Useful for dashboard reporting. |
| Thermometer | Vertical representation of the meter chart, indicating a range of qualitative indicators. |
| Dial | Used to communicate key performance indicators. |


See Meter Charts for more information.
Type | Icon | When to Use |
|---|---|---|
| Pie | You want to show the relationship of parts to the whole. Use a pie chart to highlight proportions rather than actual values. If it is important to show actual values in the chart, avoid using the pie chart type. |
| 3D Pie | Similar to the pie chart, but in three a dimensional form. |
| Multi Pie | Used to highlight individual component sizes in a system of multiple components. |
| Ring | Similar to the pie chart, but in a circular ring form. |


See Pie Charts for more information.
Type | Icon | When to Use |
|---|---|---|
| Funnel | Used to show the status of stages in a process. |
| Proportional Infographic | Displays segments on an image, with the segment size representing metric value. |
| Comparative Infographic | Displays images sized in such a way to correspond to a metric. |
| Radar | You want to compare data by integrating multiple axes into a single radial figure. |
| Waterfall | Waterfall charts are a special type of Floating Column Chart. A typical waterfall chart shows how an initial value is increased and decreased by a series of intermediate values, leading to a final value. |
| Event | Maps the occurrence of events against the values of a numeric data set over time. |
| Week Density | Shows the density of occurrences based on hour relative to other densities on the same day of the week. |
| Digital Numeric Display | Shows the value of a metric on a digital display. |
| Numeric Display | Shows the value of a metric. |


See Special Purpose Charts for more information.
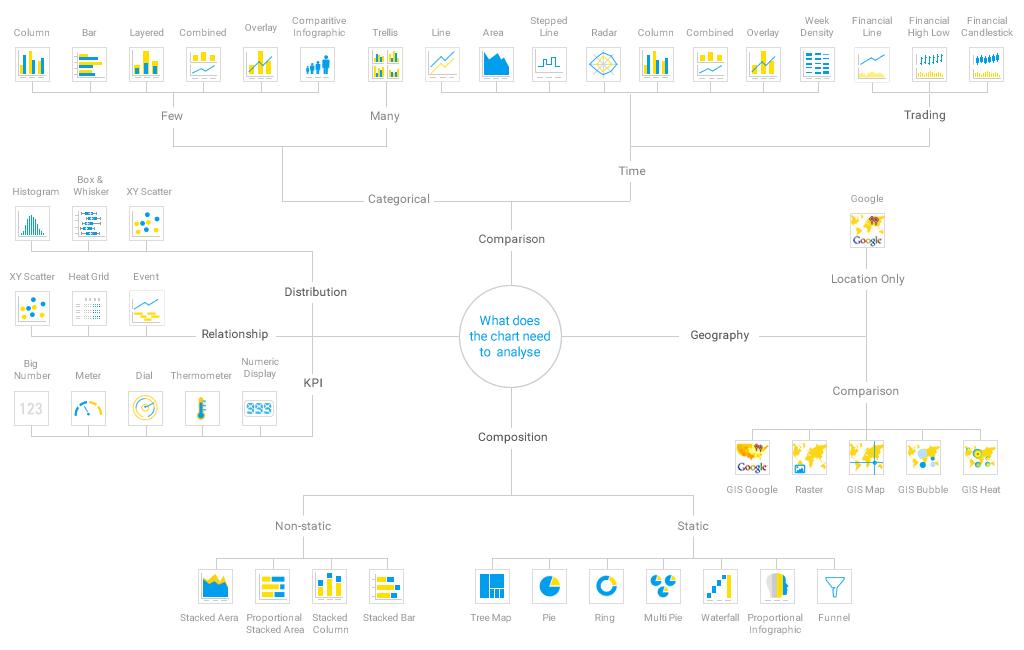
Chart Selector Guide