Overview
Numeric display charts allow you to highlight the total value of a particular metric. There are two types of numeric display charts available in Yellowfin:
| Type | Icon | Description |
|---|---|---|
Numeric Display |
| Shows the value of a metric field, either defined by the aggregation applied to it, or the column total aggregation if available. |
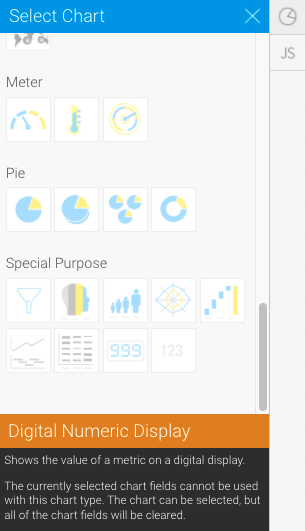
Digital Numeric Display |
| Shows the value of a metric on a digital display. |


Numeric display charts only display a single metric field.
Numeric display chart data options
| Option | Description |
|---|---|
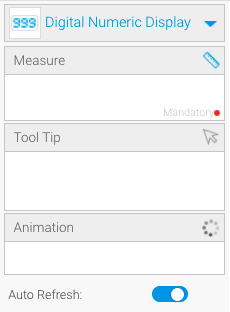
Measure | Must be a metric. This option configures the value displayed on the chart. |
Tooltip | Can be a metric or a dimension. This option displays additional information in the tooltip, and is only available for Digital Numeric Display charts. |
Animation | Must be a date or time field. |
Creating a numeric display chart
- Click on the Create button in the top right corner of your screen to create a new report
- Use your mouse to drag your data from the left panel to the Columns field
Numeric display charts require metric fields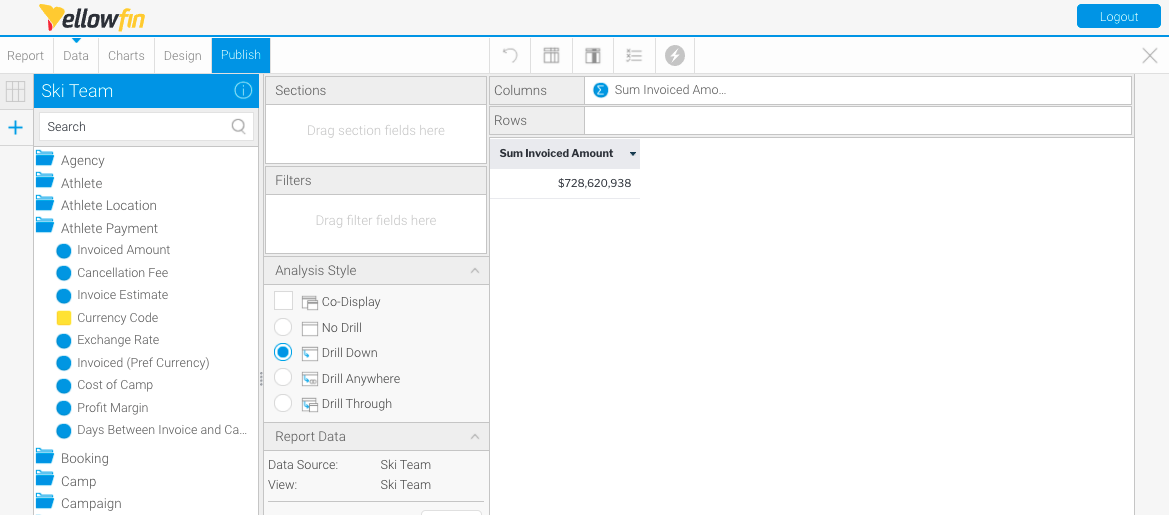
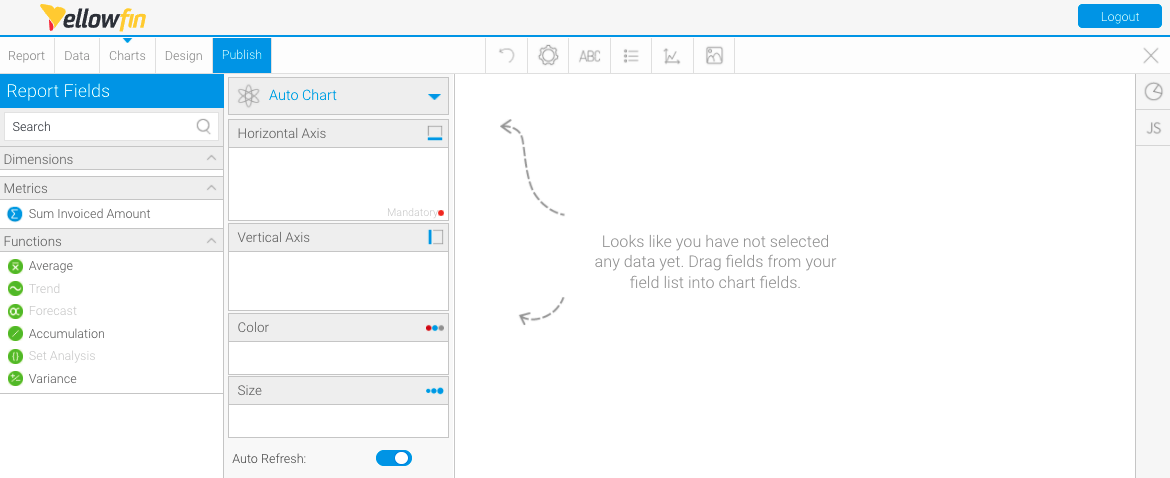
- Click Charts from the toolbar to create your chart
- Click Auto Chart, then click Select Chart Type
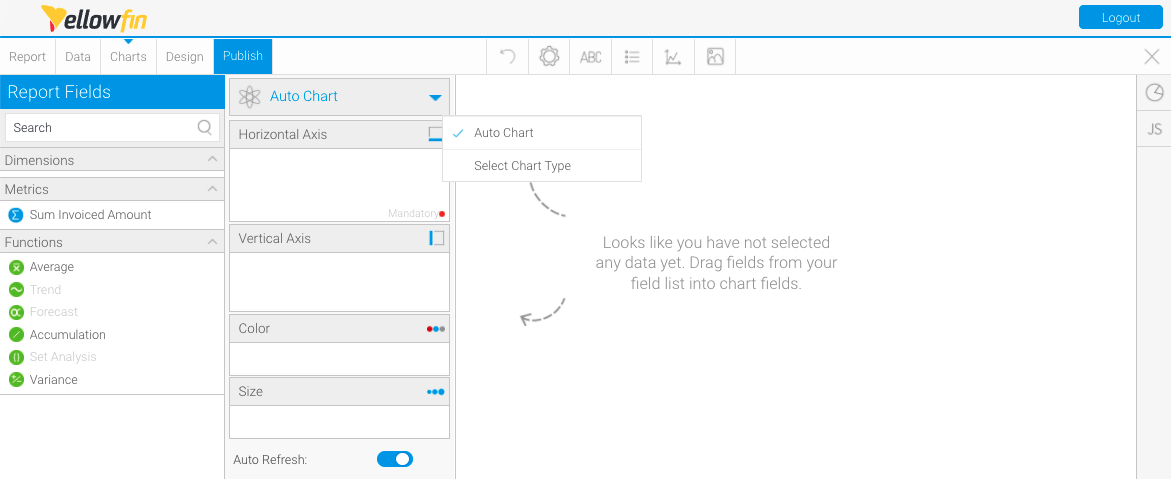
The Select Chart panel will slide in from the right-hand side of the page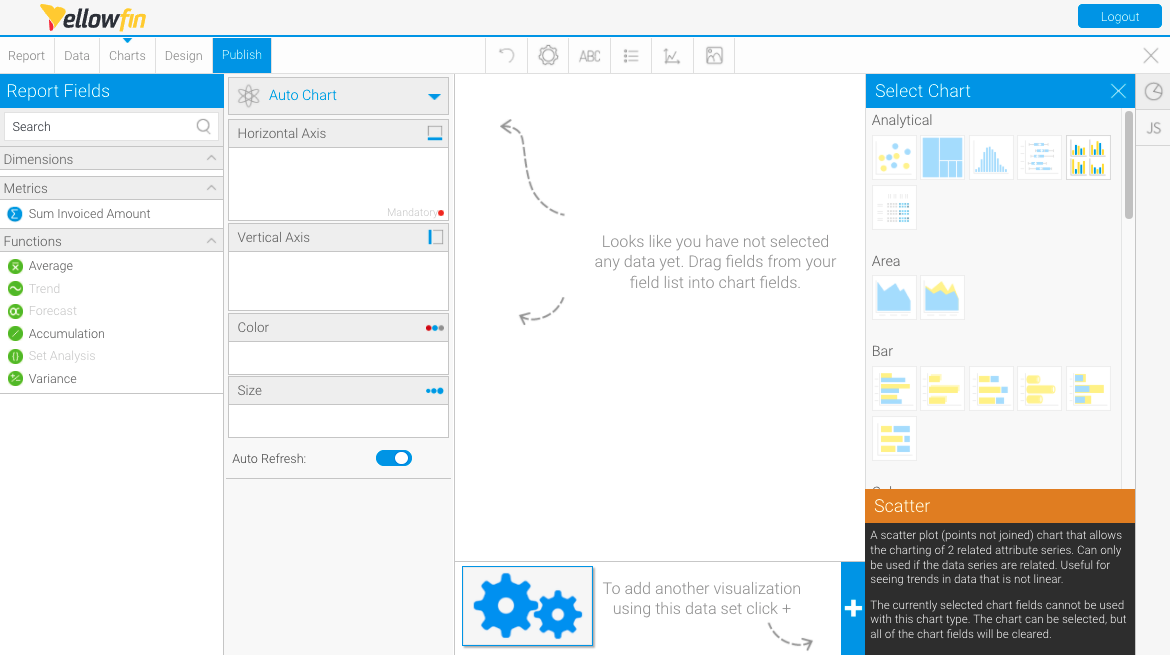
- Scroll on the Select Chart panel until you reach Special Purpose charts, and select Digital Numeric Display as the chart type from the bottom right-hand side of the panel
- Use your mouse to drag a metric from the left panel to the Measure field
The chart will render automatically once your data is selected