Overview
With Guided NLQ, you can create highly readable report content and insert it into a dashboard, story or presentation without ever using the Report Builder. Presuming you have access to your target dashboard, story or presentation (or rights to create new ones), you can add your report directly from the Guided NLQ window.
Add your answer to a dashboard
Before starting the steps below, make sure you’ve asked a valid question. If you’re not sure how to ask a question, read about how to ask a question here.
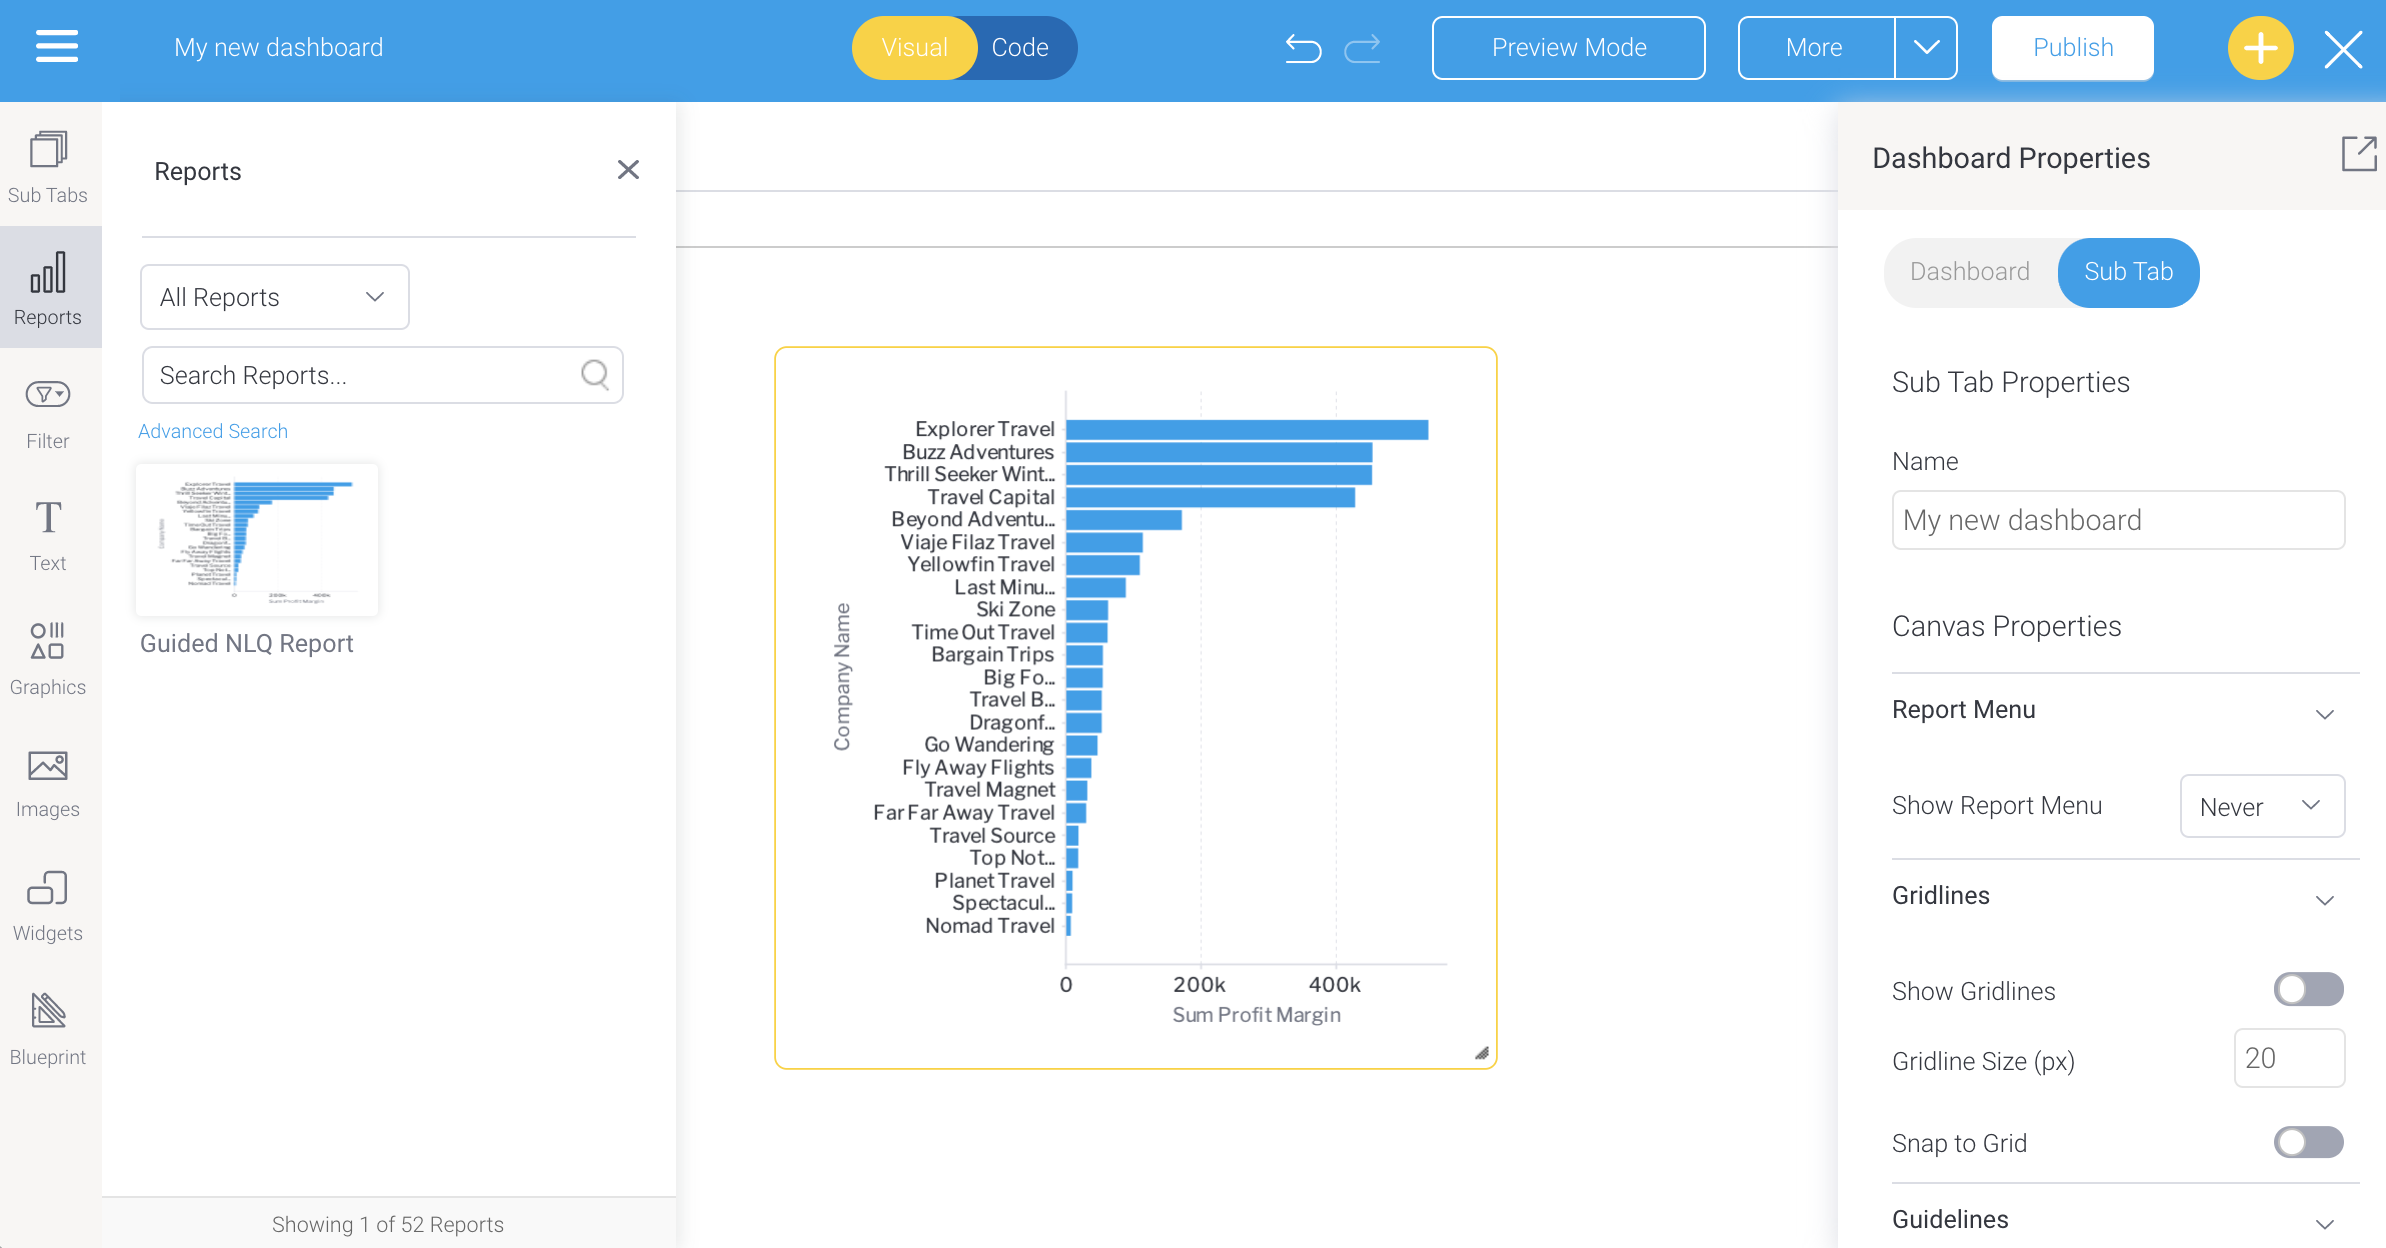
- Ensure you’re looking at the answer to a question you’ve asked in Guided NLQ (we’ve used Ski Team data to produce an answer to the question: For Last Year (Start Date) Show Profit Margin (Sum) by Company Name)
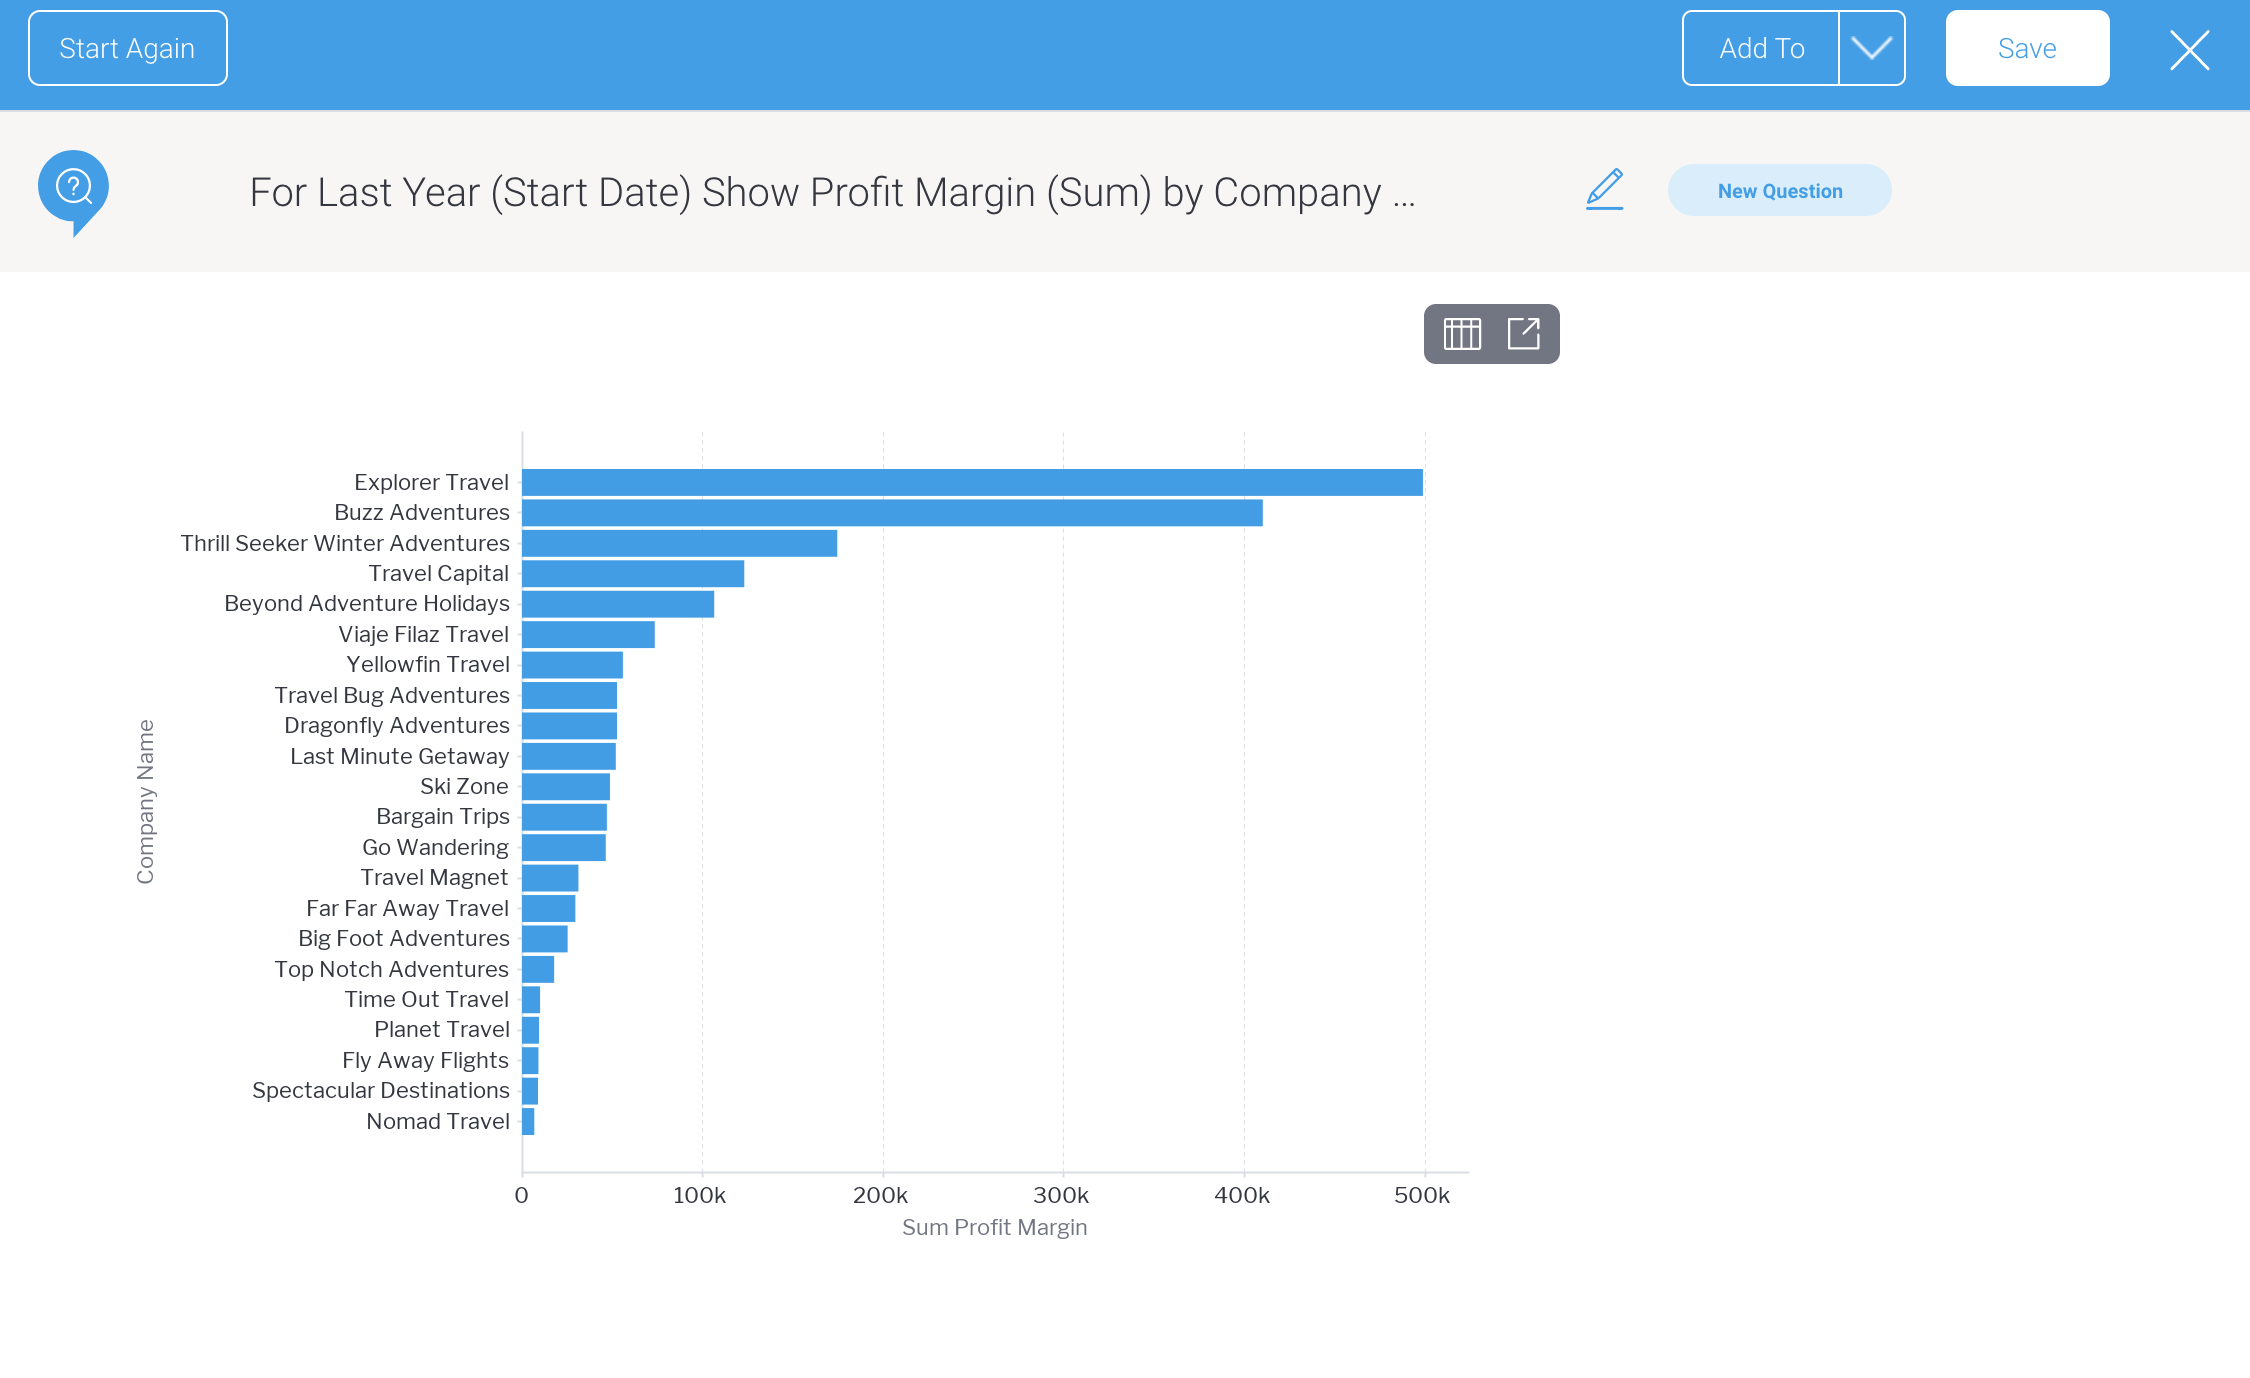
- Click anywhere on the Add To button

- From the dropdown, select Dashboard
The Save as Report dialog box will appear, which you may adjust or leave as is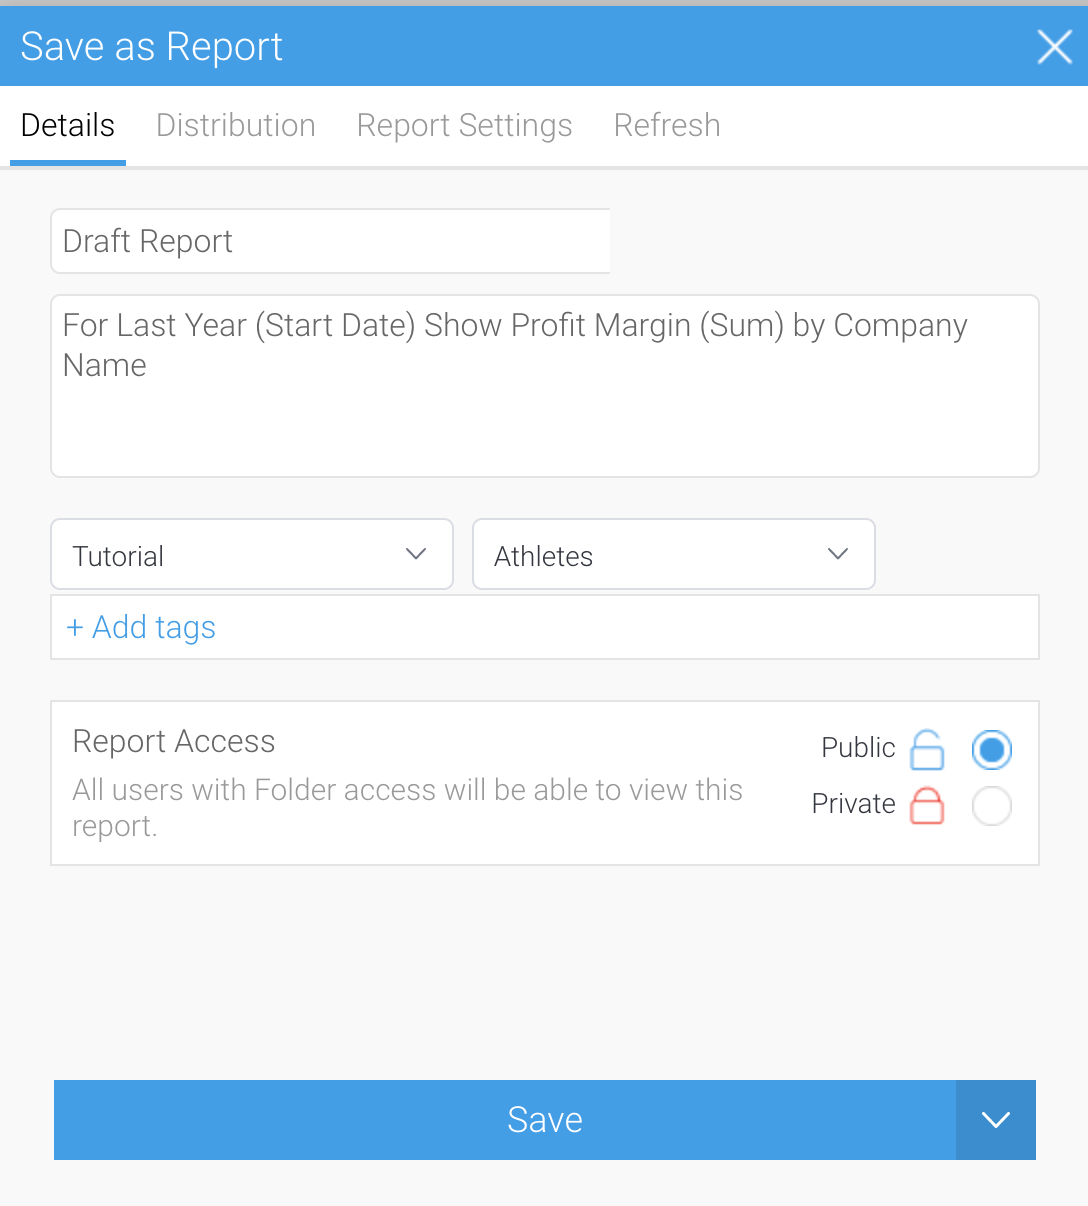
- If you wish to change the report name and any other fields to something more meaningful, click on the fields to update them
- Click the Save button
The Choose a Draft Dashboard dialog box will appear, showing a preview of your report and options for adding your report to an existing draft dashboard or a new dashboard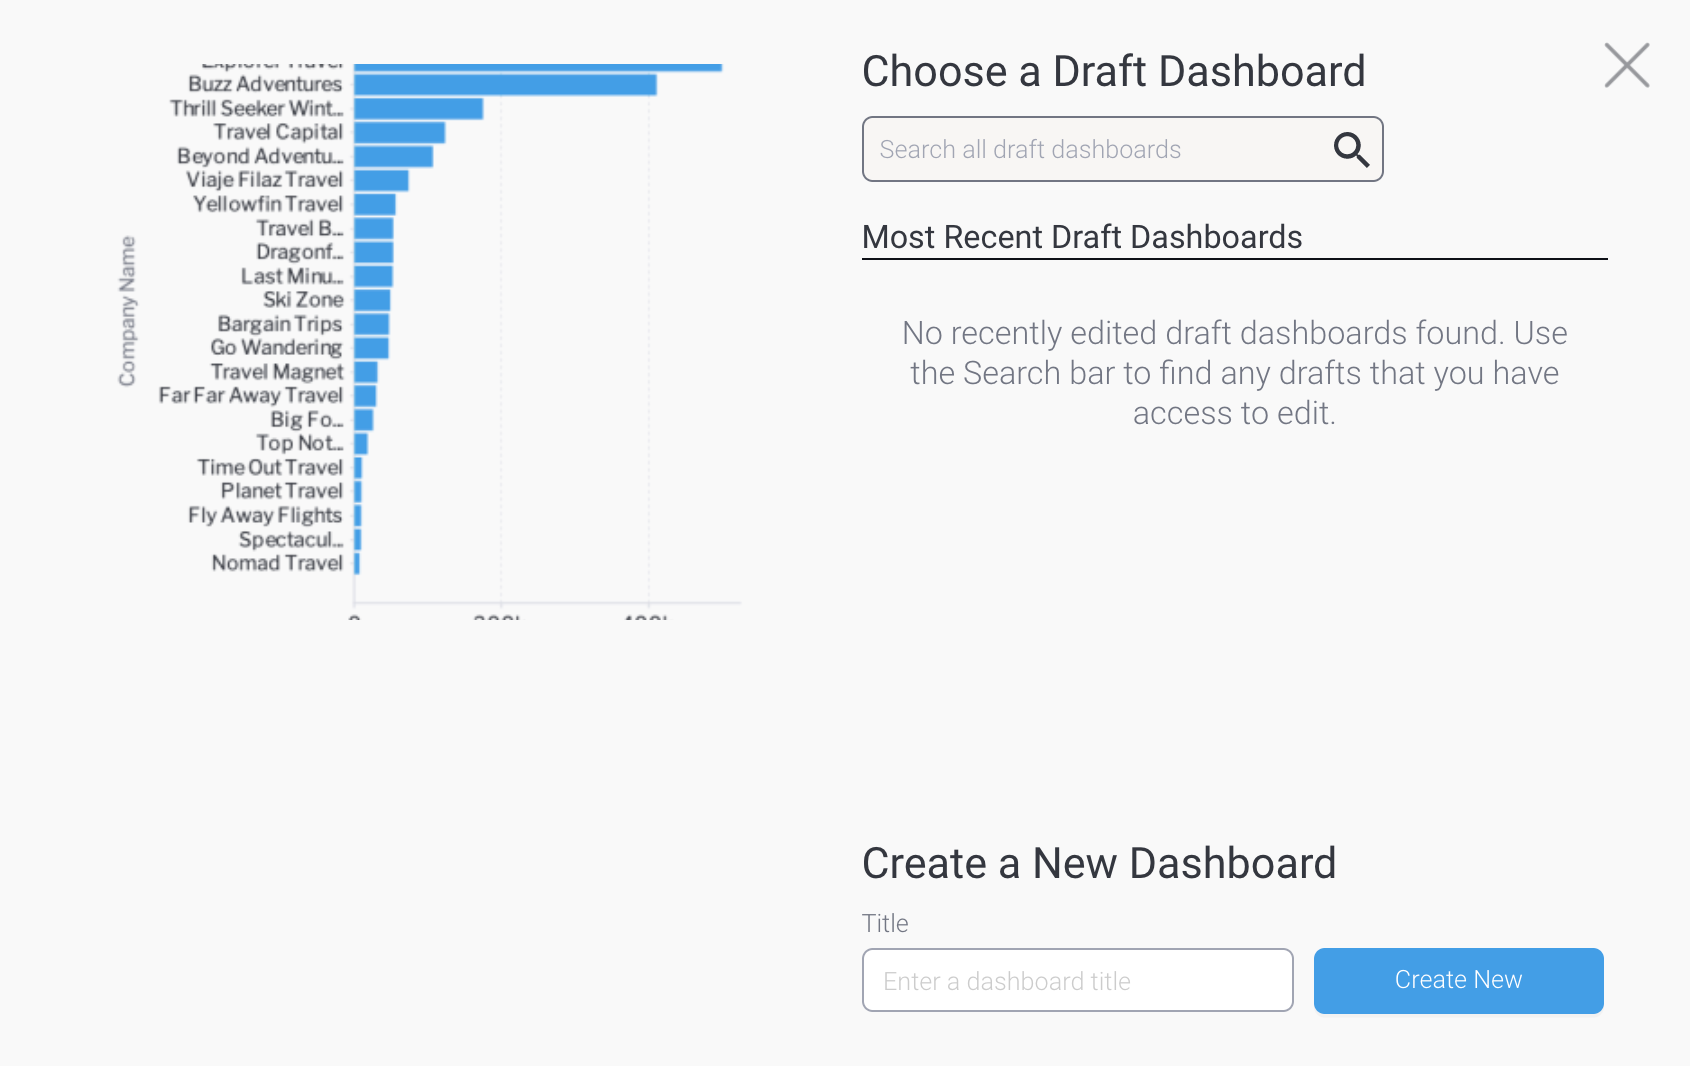
- If you would like to use an existing draft dashboard and you can see it in the Most Recent Draft Dashboards list, click on it to select it
- If you would like to use an existing draft dashboard but you can’t see it listed, use the search tool to find an older draft dashboard, or one that you have access to edit even if you’re not the owner
- If you would like to add your report to a new dashboard, type a name for the dashboard in the Title field, then click the Create New button
A dialog box may appear to confirm you wish to leave Guided NLQ (if you have multi-tab enabled, this message won’t appear and you will see your dashboard in a new browser tab)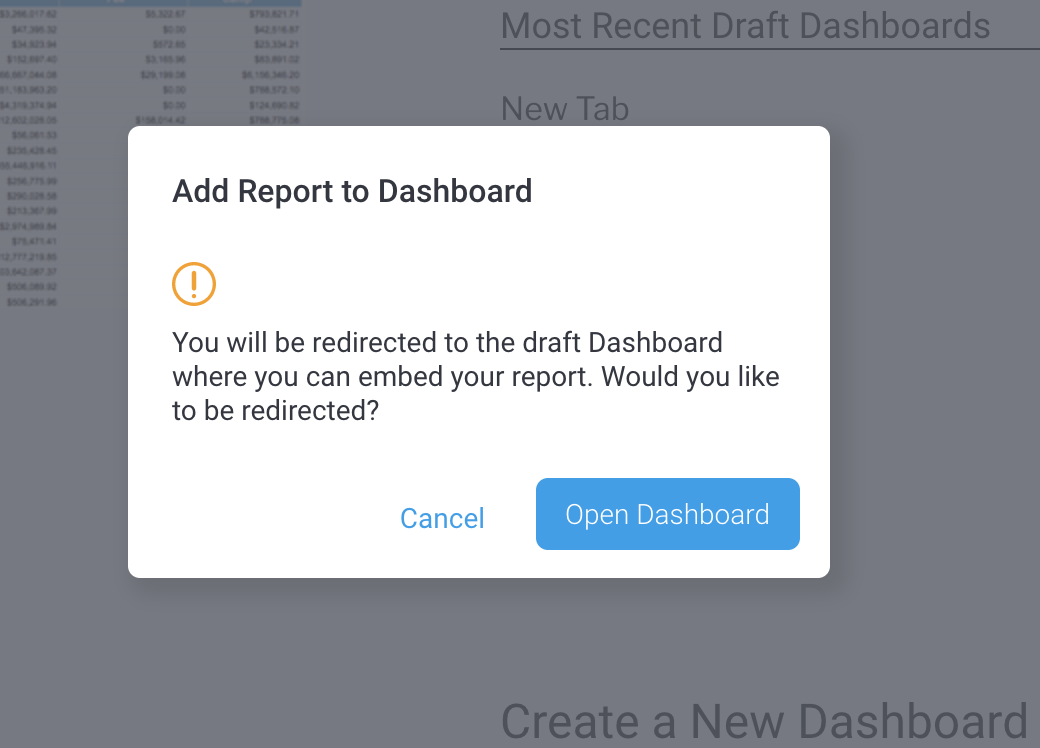
- If the dialog box appears, click the Open Dashboard button
Your draft dashboard will be displayed with your report showing under the Reports panel on the left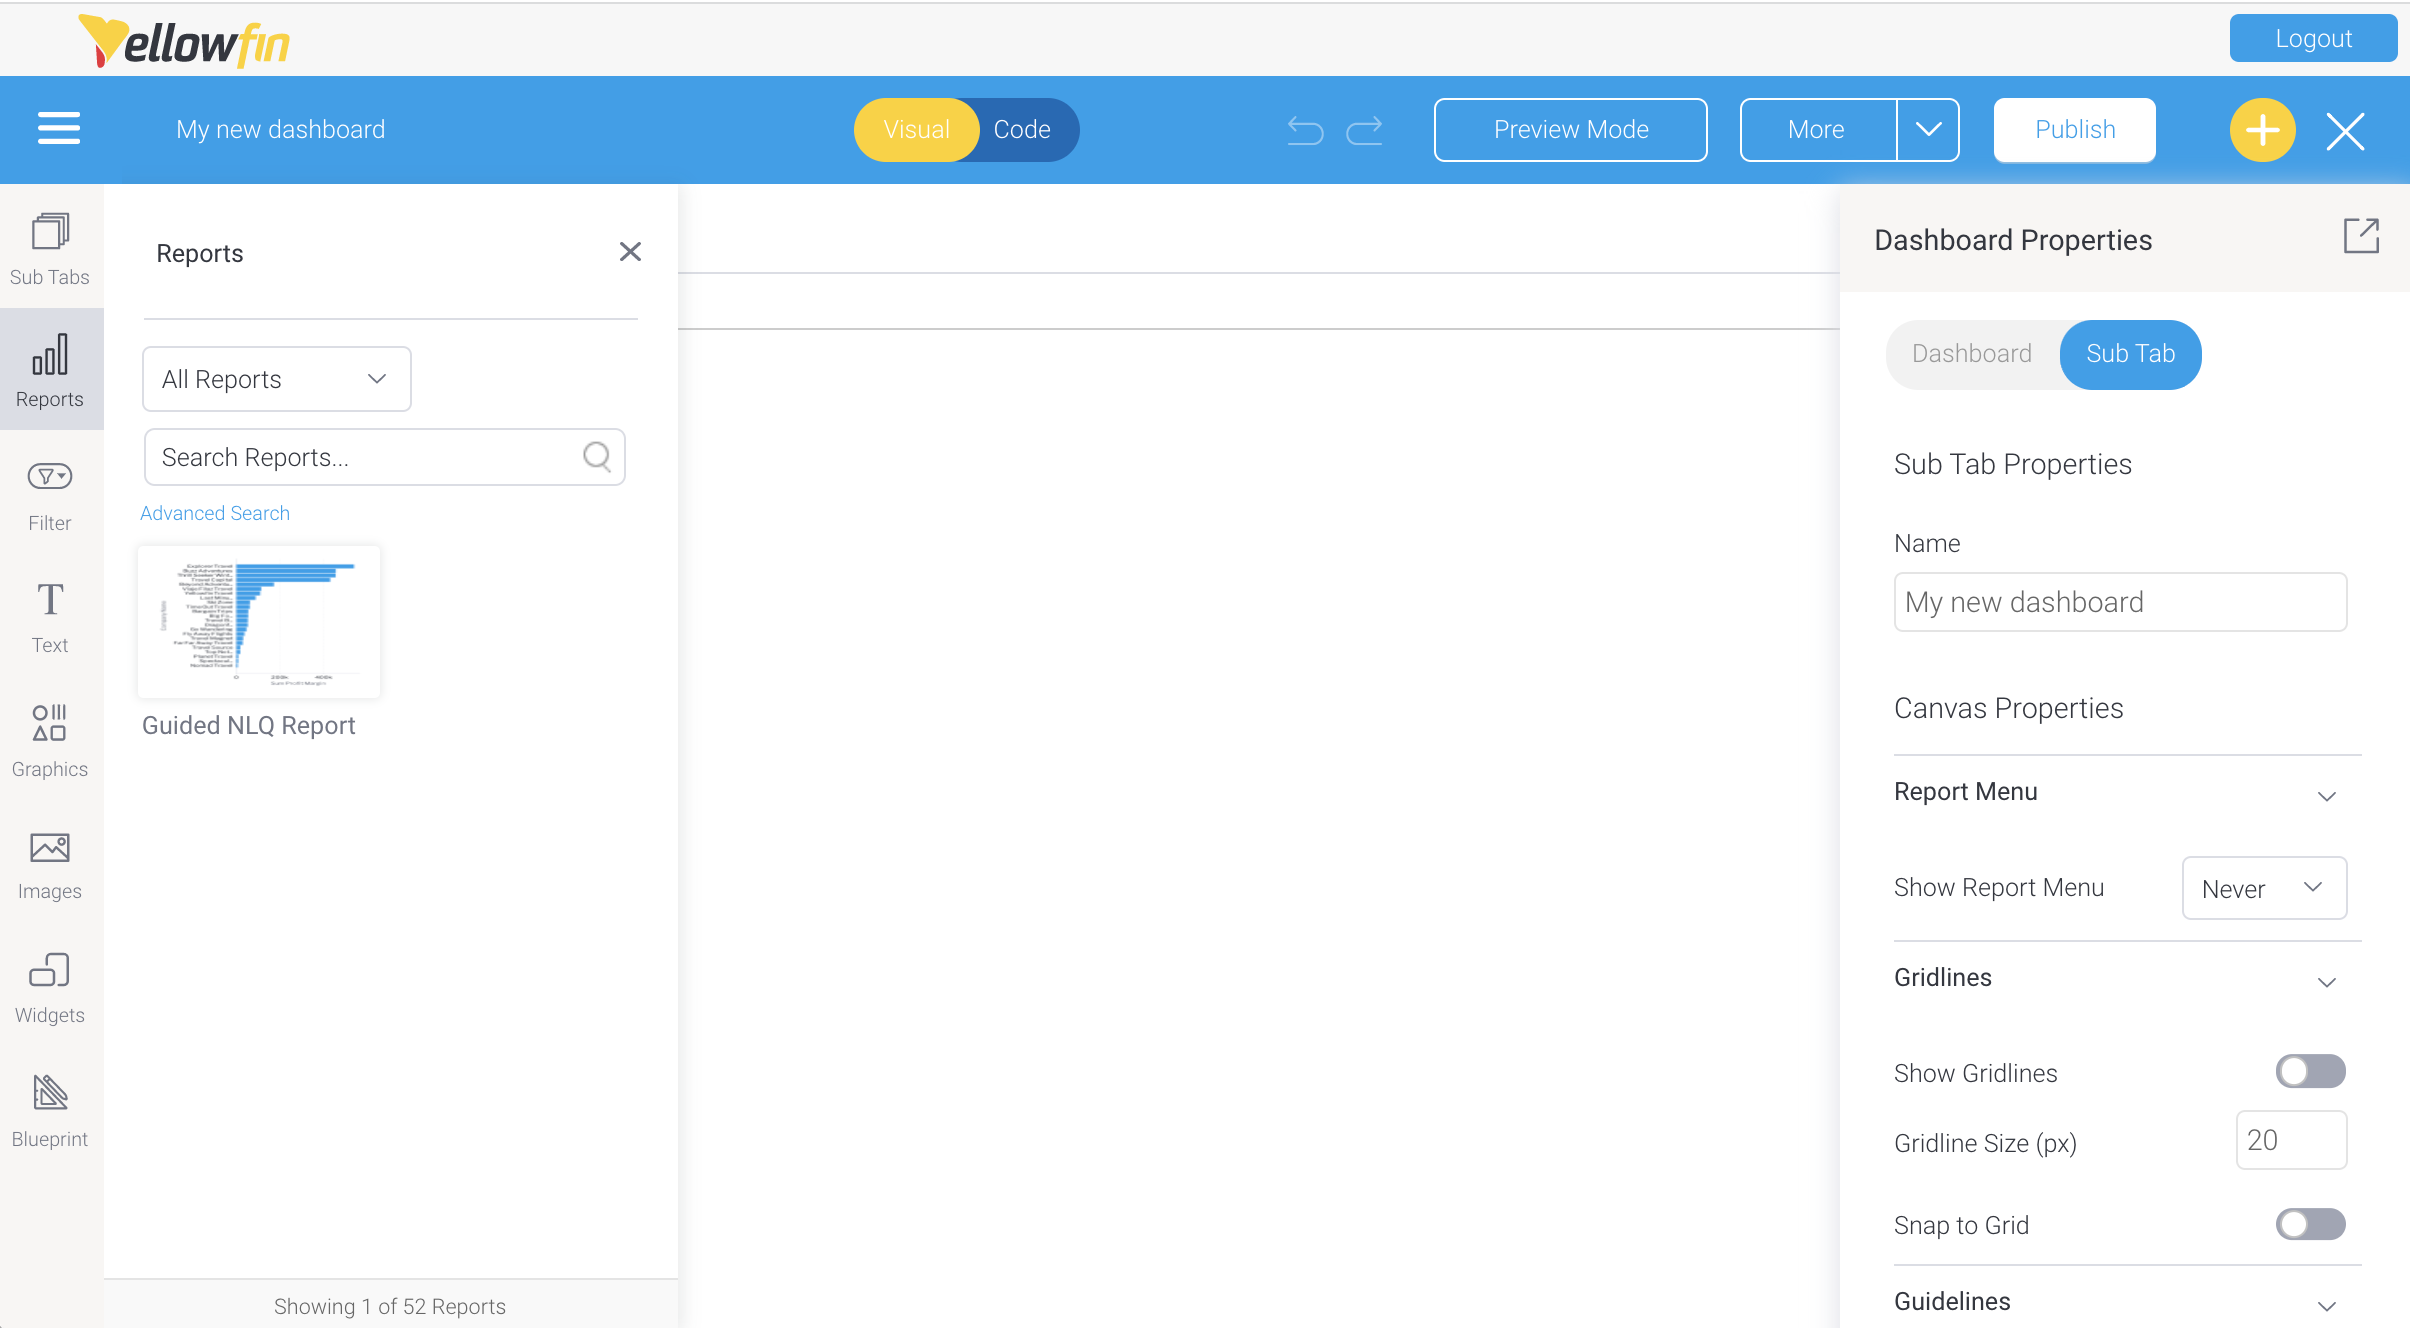
- Hover your mouse over the report and drag it to the dashboard canvas
- If you need further information about working with reports in dashboards, see the wiki section for dashboard creation
Add your answer to a story
Before starting the steps below, make sure you’ve asked a valid question. If you’re not sure how to ask a question, read about how to ask a question here.
- Ensure you’re looking at the answer to a question you’ve asked in Guided NLQ (we’ve used Ski Team data to produce an answer to the question: For Last Year (Start Date) Show Profit Margin (Sum) by Company Name)
- Click anywhere on the Add To button
- From the dropdown, select Story
The Save as Report dialog box will appear, which you may adjust or leave as is - If you wish to change the report name and any other fields to something more meaningful, click on the fields to update them
- Click the Save button
The Choose a Draft Story dialog box will appear, showing a preview of your report and options for adding your report to an existing draft story or a new story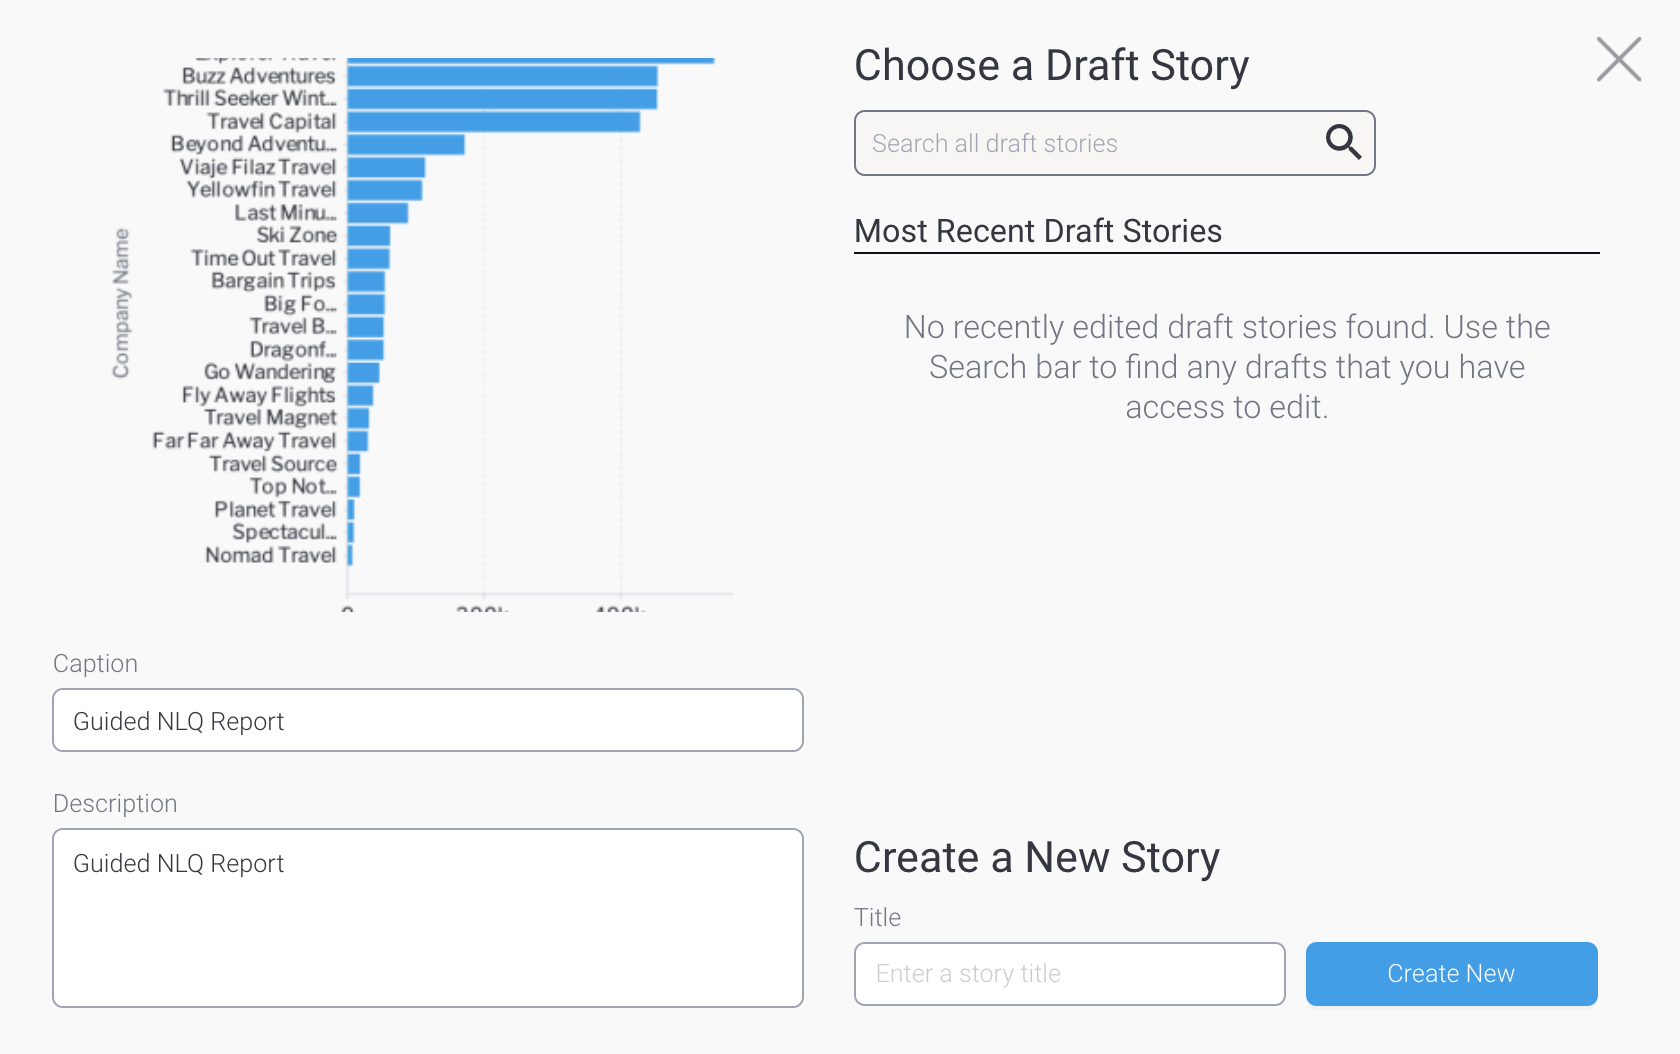
- If you would like to use an existing draft story and you can see it in the Most Recent Draft Stories list, click on it to select it
- If you would like to use an existing draft story but you can’t see it listed, use the search tool to find an older draft story, or one that you have access to edit even if you’re not the owner
- If you would like to add your report to a new story, type a name for the story in the Title field, then click the Create New button
A dialog box may appear to confirm you wish to leave Guided NLQ (if you have multi-tab enabled, this message won’t appear and you will see your story in a new browser tab)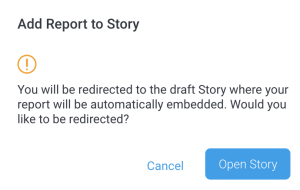
- If the dialog box appears, click the Open Story button
Your draft story will be displayed with your report showing within the story itself (at the end of any existing content, where it can be dragged to a new position of your choice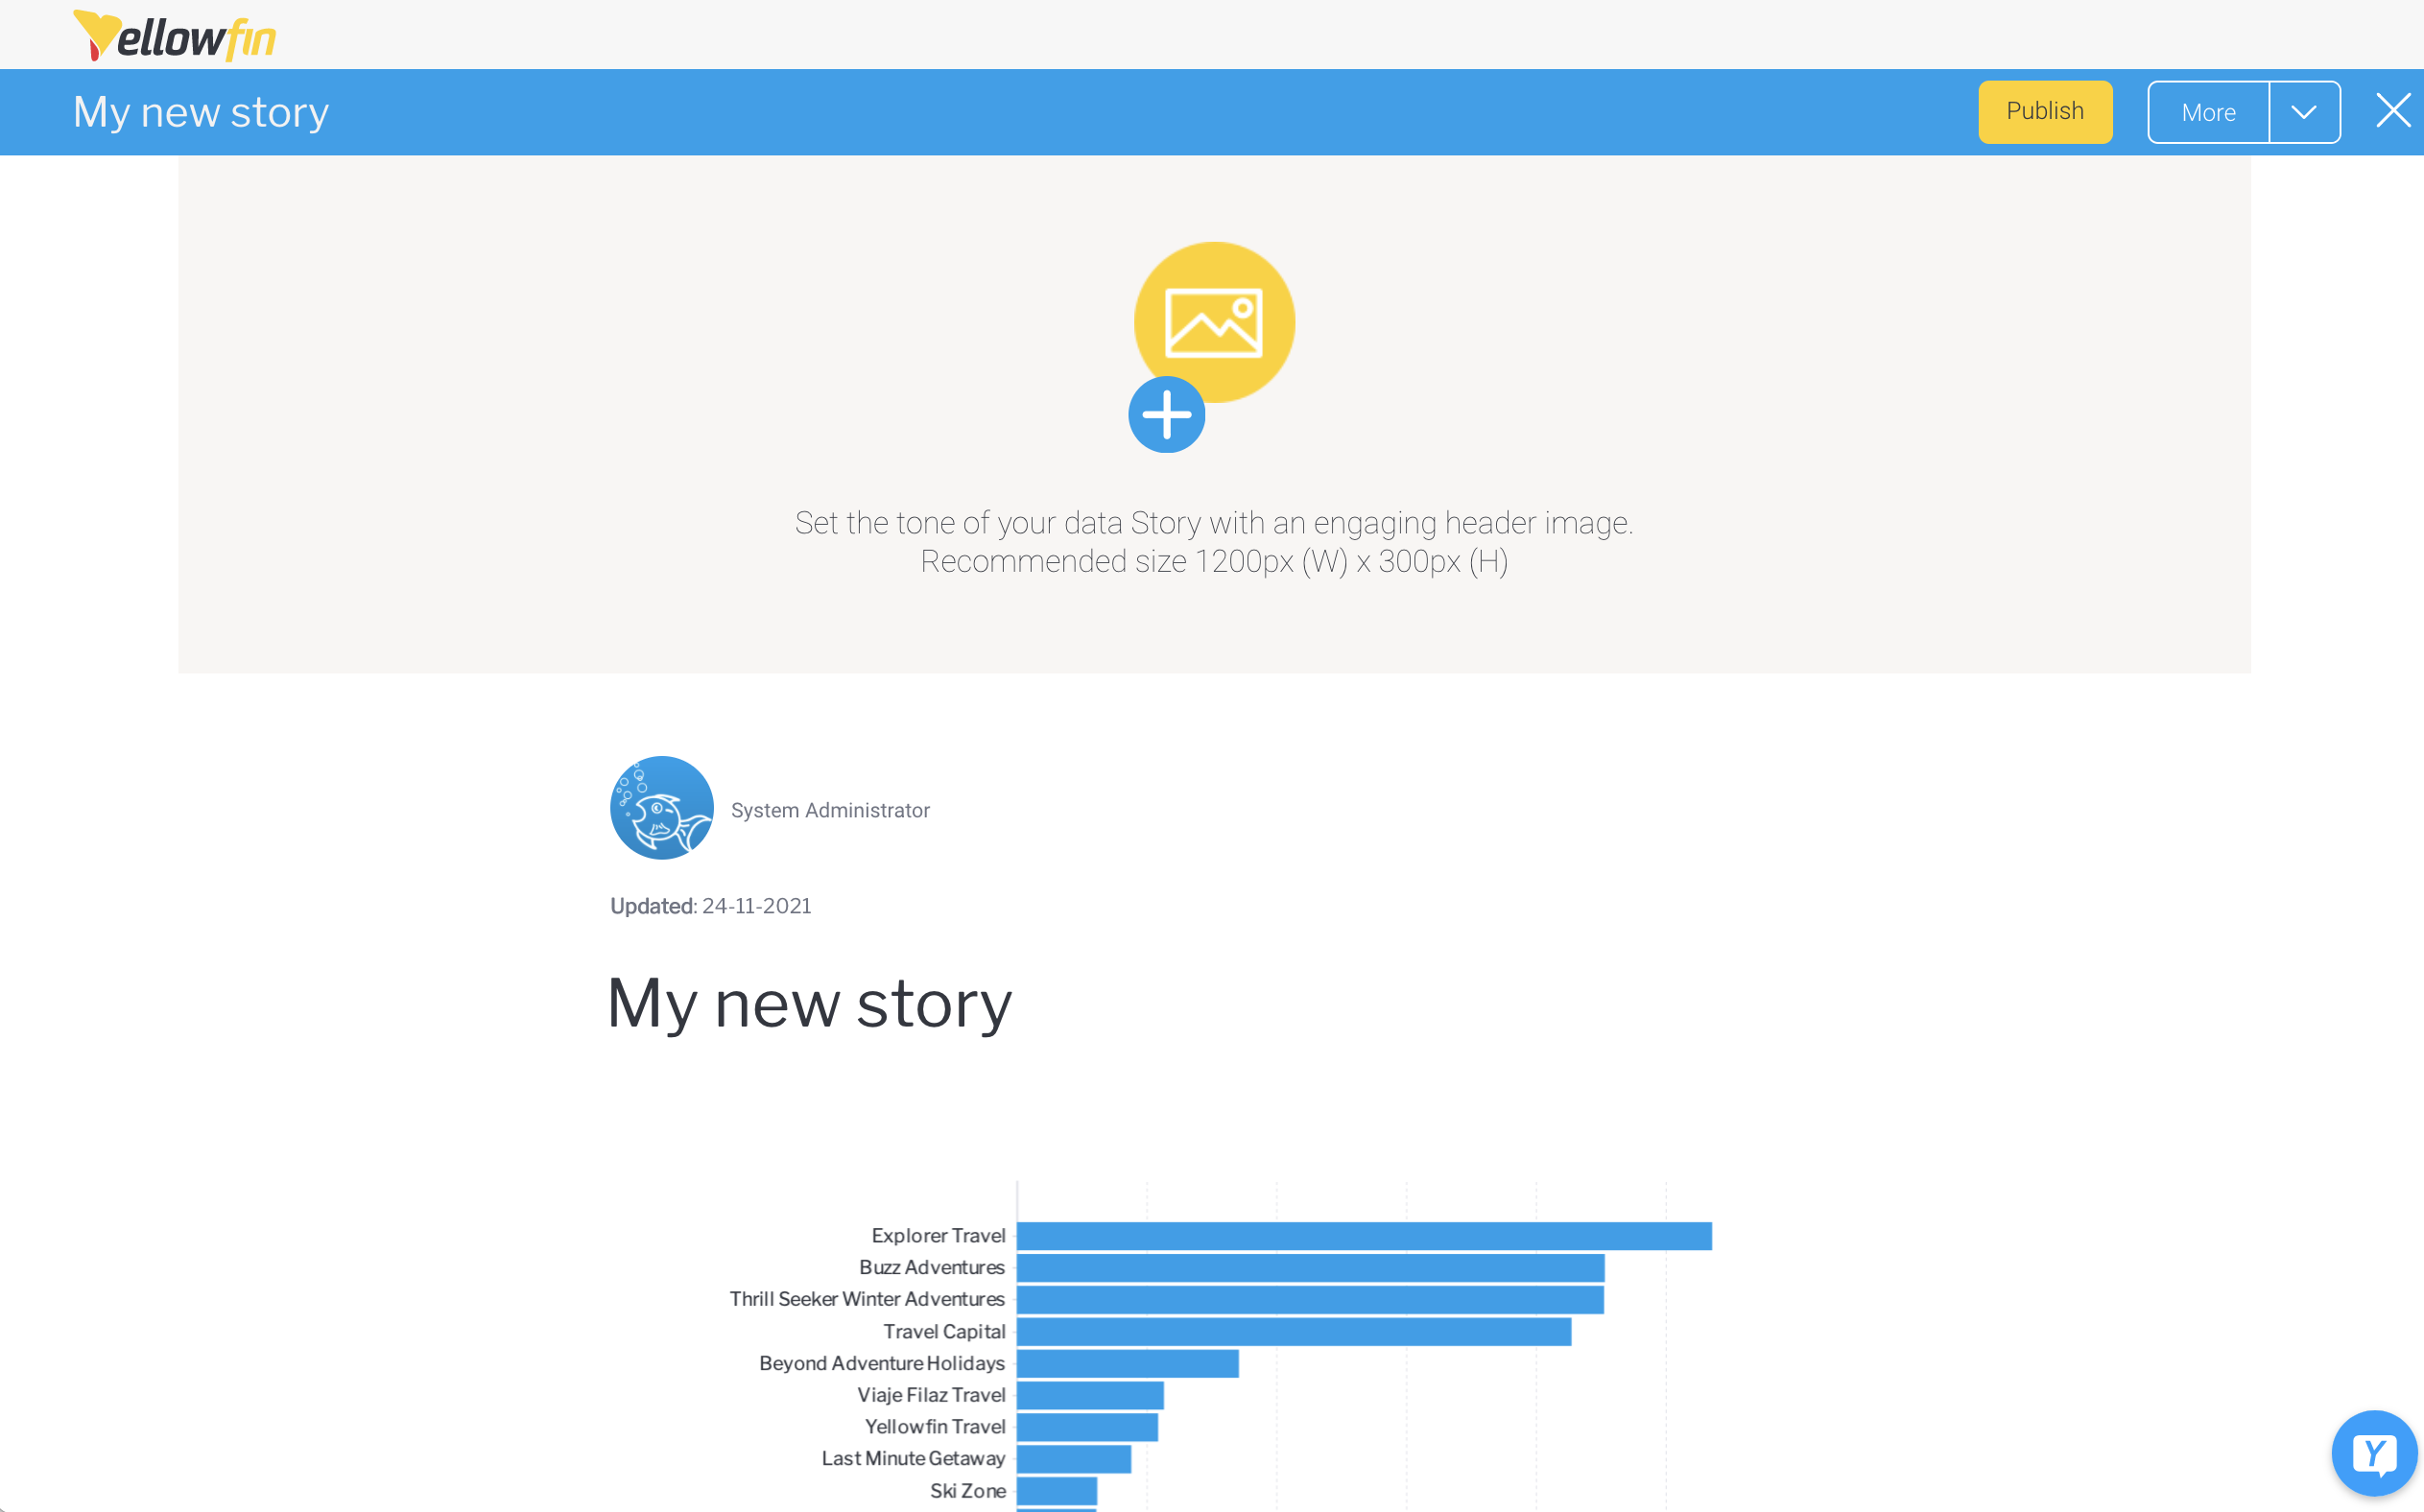
You can now interact with the report the same way you would from within any story - If you need further information about working with reports in stories, see the wiki section for story creation
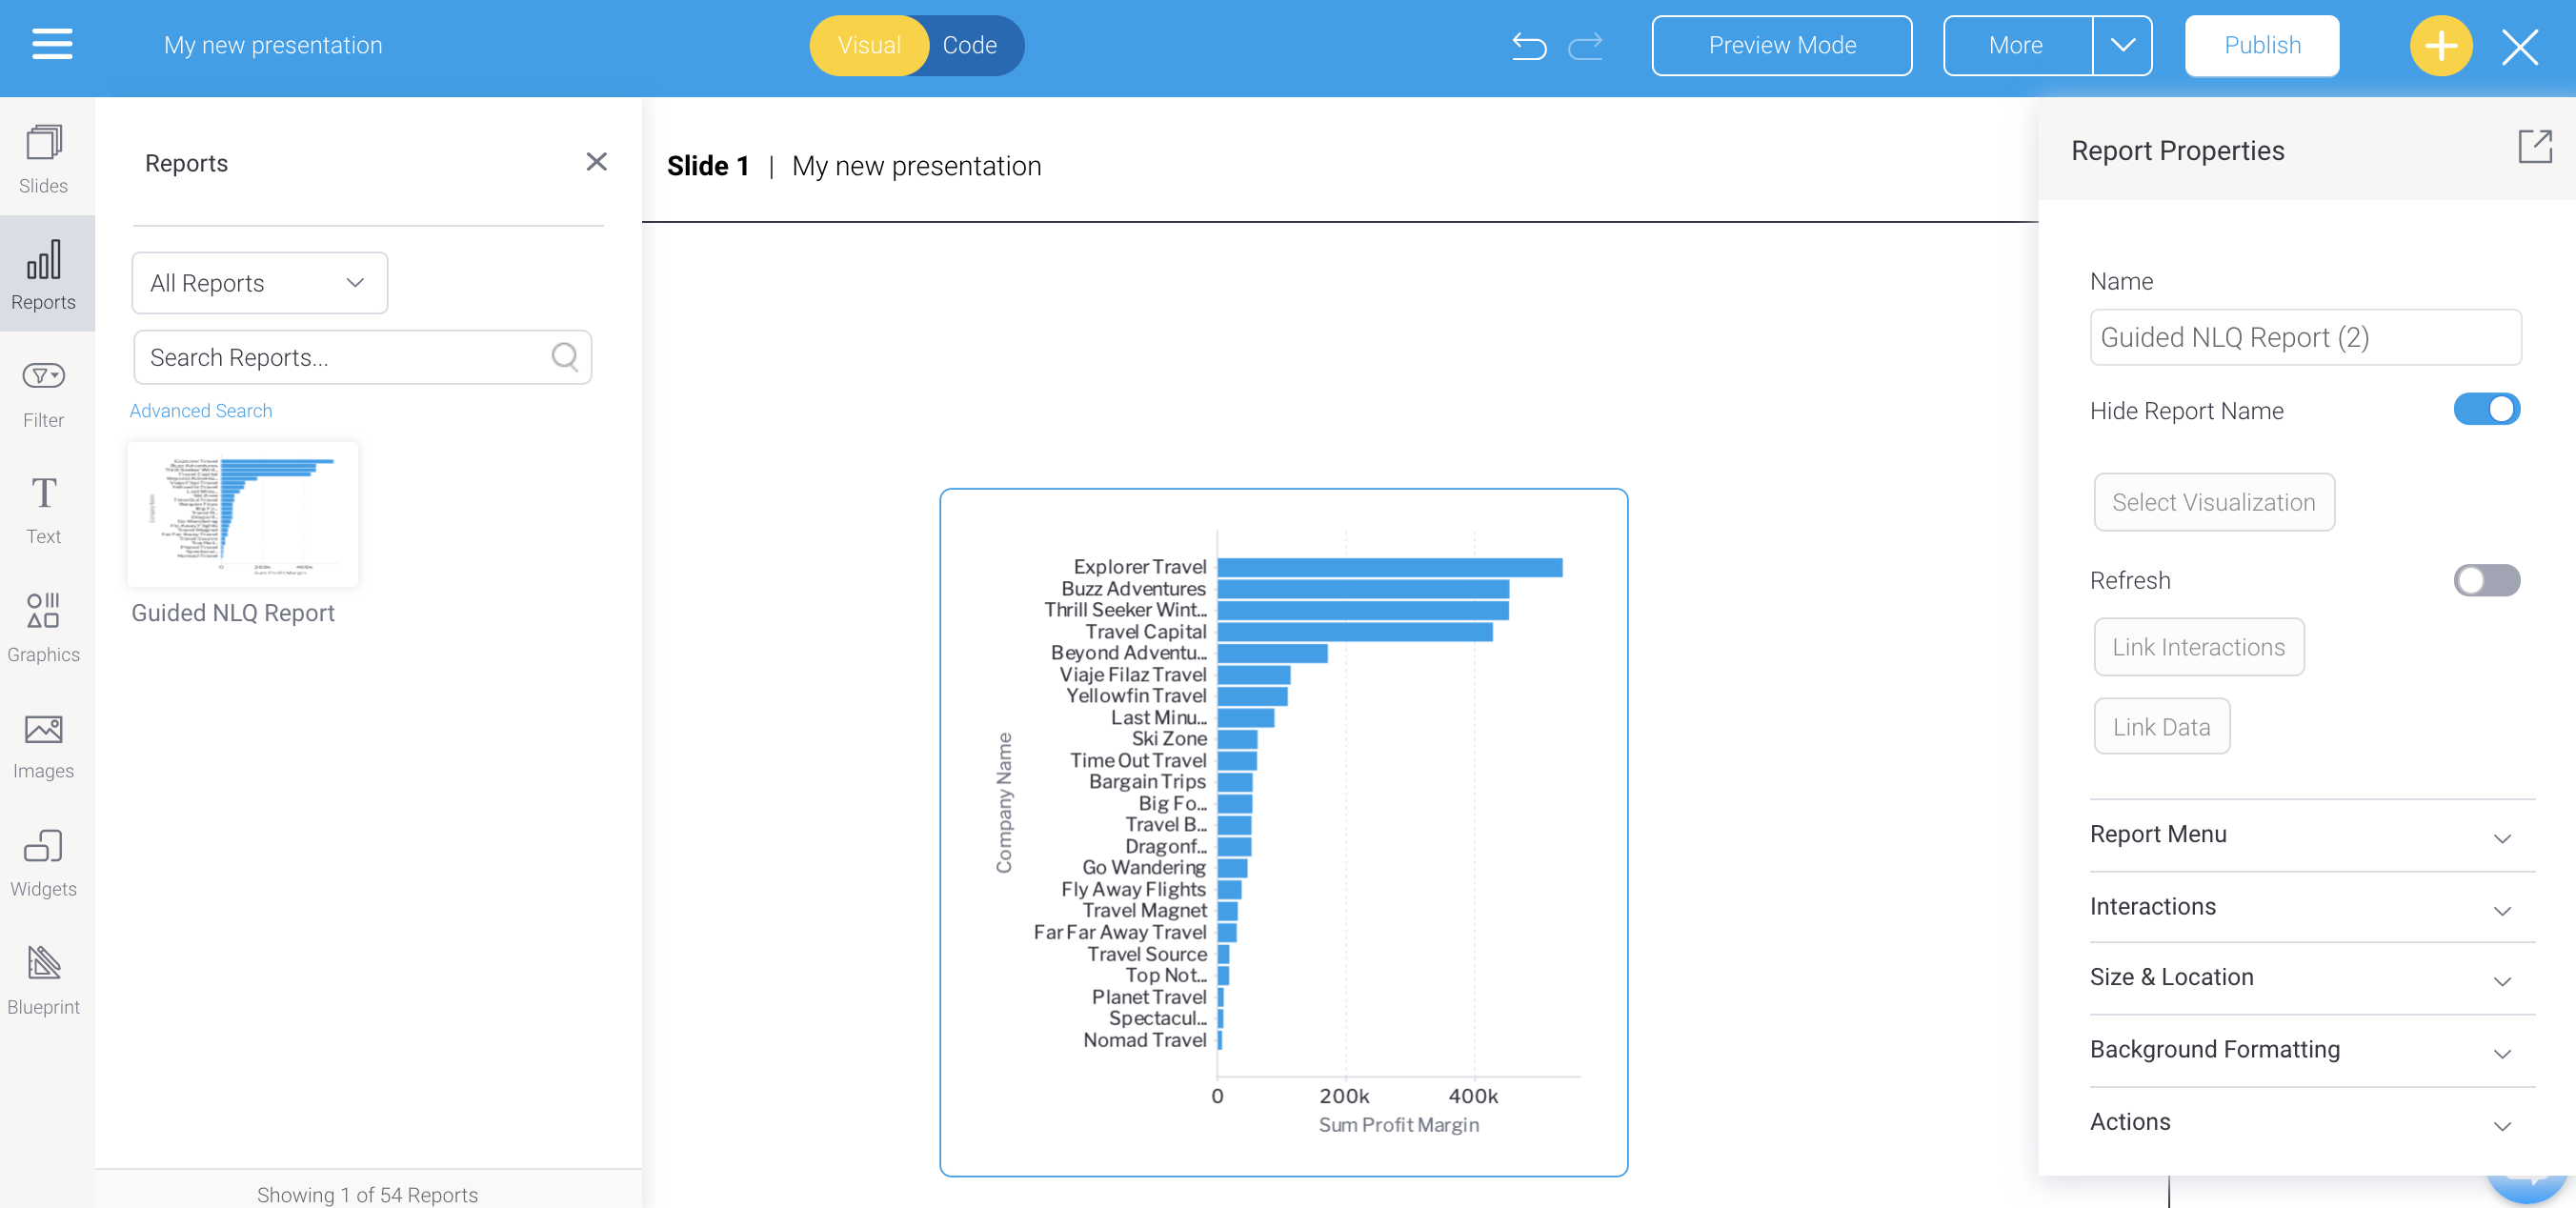
Add your answer to a presentation
Before starting the steps below, make sure you’ve asked a valid question. If you’re not sure how to ask a question, read about how to ask a question here.
- Ensure you’re looking at the answer to a question you’ve asked in Guided NLQ (we’ve used Ski Team data to produce an answer to the question: For Last Year (Start Date) Show Profit Margin (Sum) by Company Name)
- Click anywhere on the Add To button
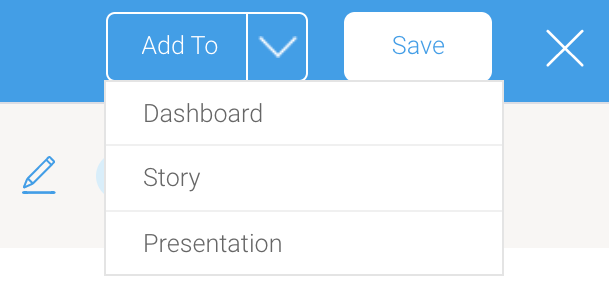
- From the dropdown, select Presentation
The Save as Report dialog box will appear, which you may adjust or leave as is - If you wish to change the report name and any other fields to something more meaningful, click on the fields to update them
- Click the Save button
The Choose a Draft Presentation dialog box will appear, showing a preview of your report and options for adding your report to an existing draft presentation or a new presentation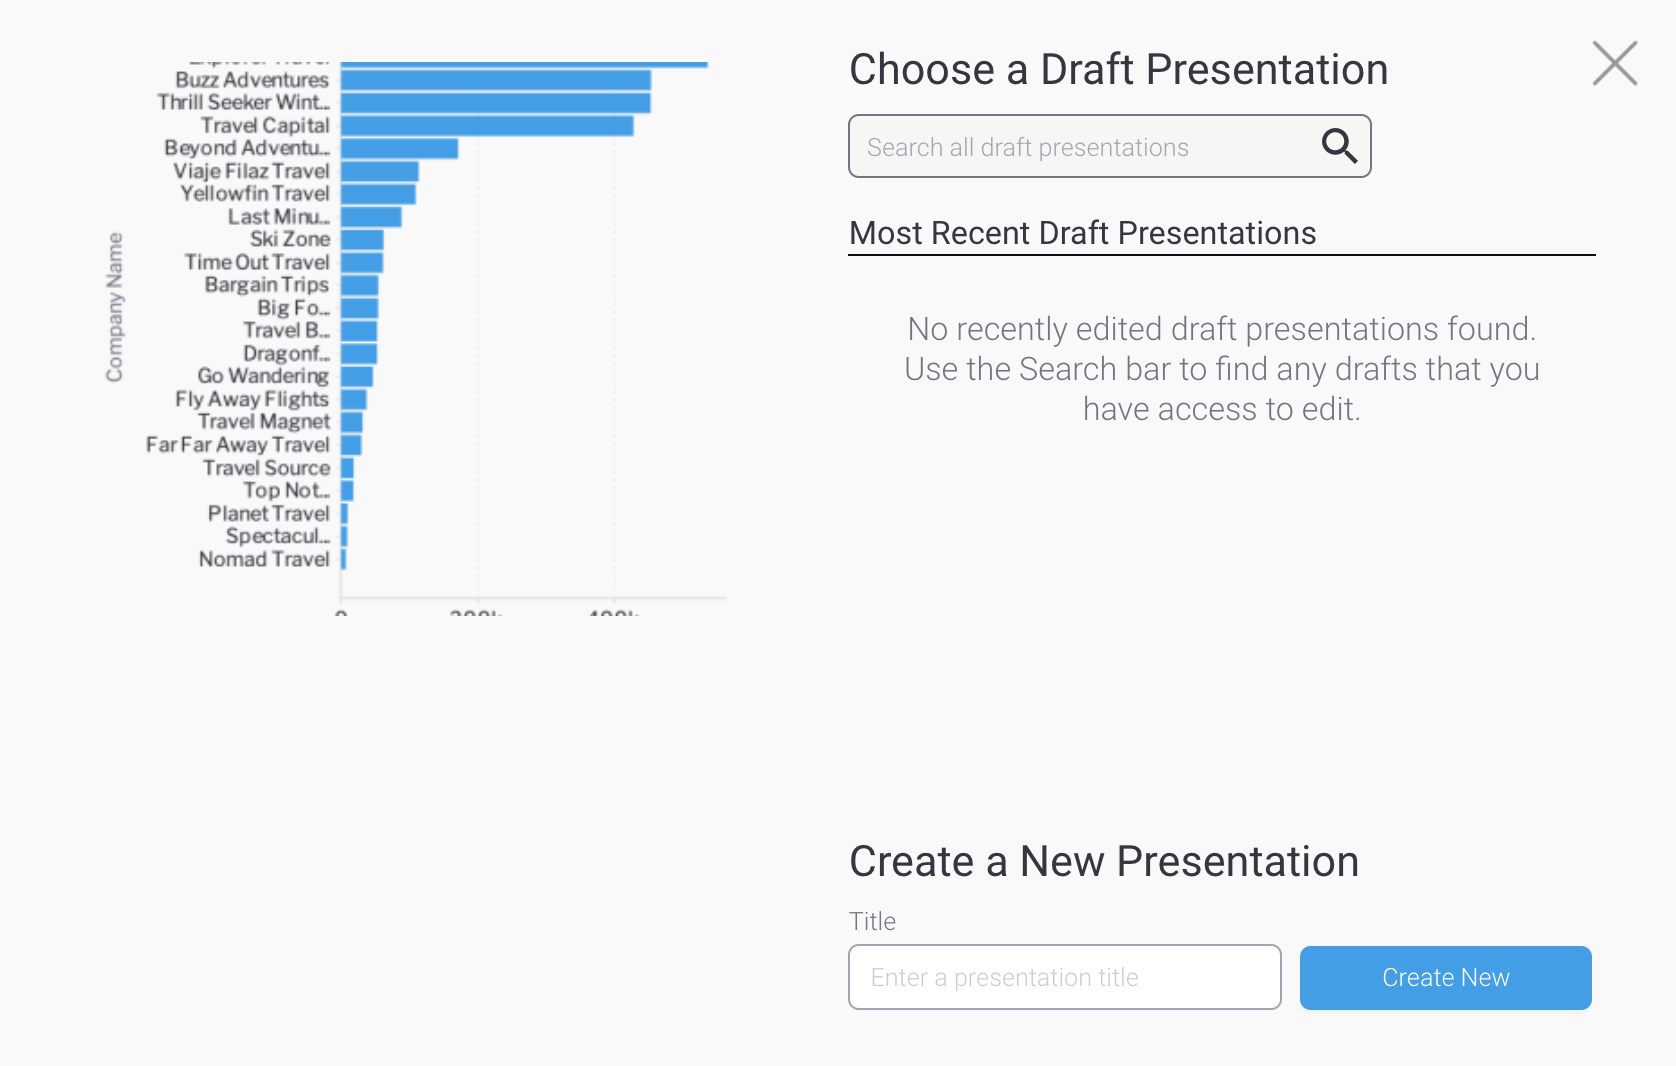
- If you would like to use an existing draft presentation and you can see it in the Most Recent Draft Presentations list, click on it to select it
- If you would like to use an existing draft presentation but you can’t see it listed, use the search tool to find an older draft presentation, or one that you have access to edit even if you’re not the owner
- If you would like to add your report to a new presentation, type a name for the presentation in the Title field, then click the Create New button
A dialog box may appear to confirm you wish to leave Guided NLQ (if you have multi-tab enabled, this message won’t appear)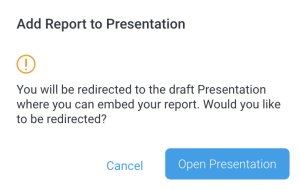
- If the dialog box appears, click the Open Presentation button
Your draft presentation will be displayed with your presentation showing under the Reports panel on the left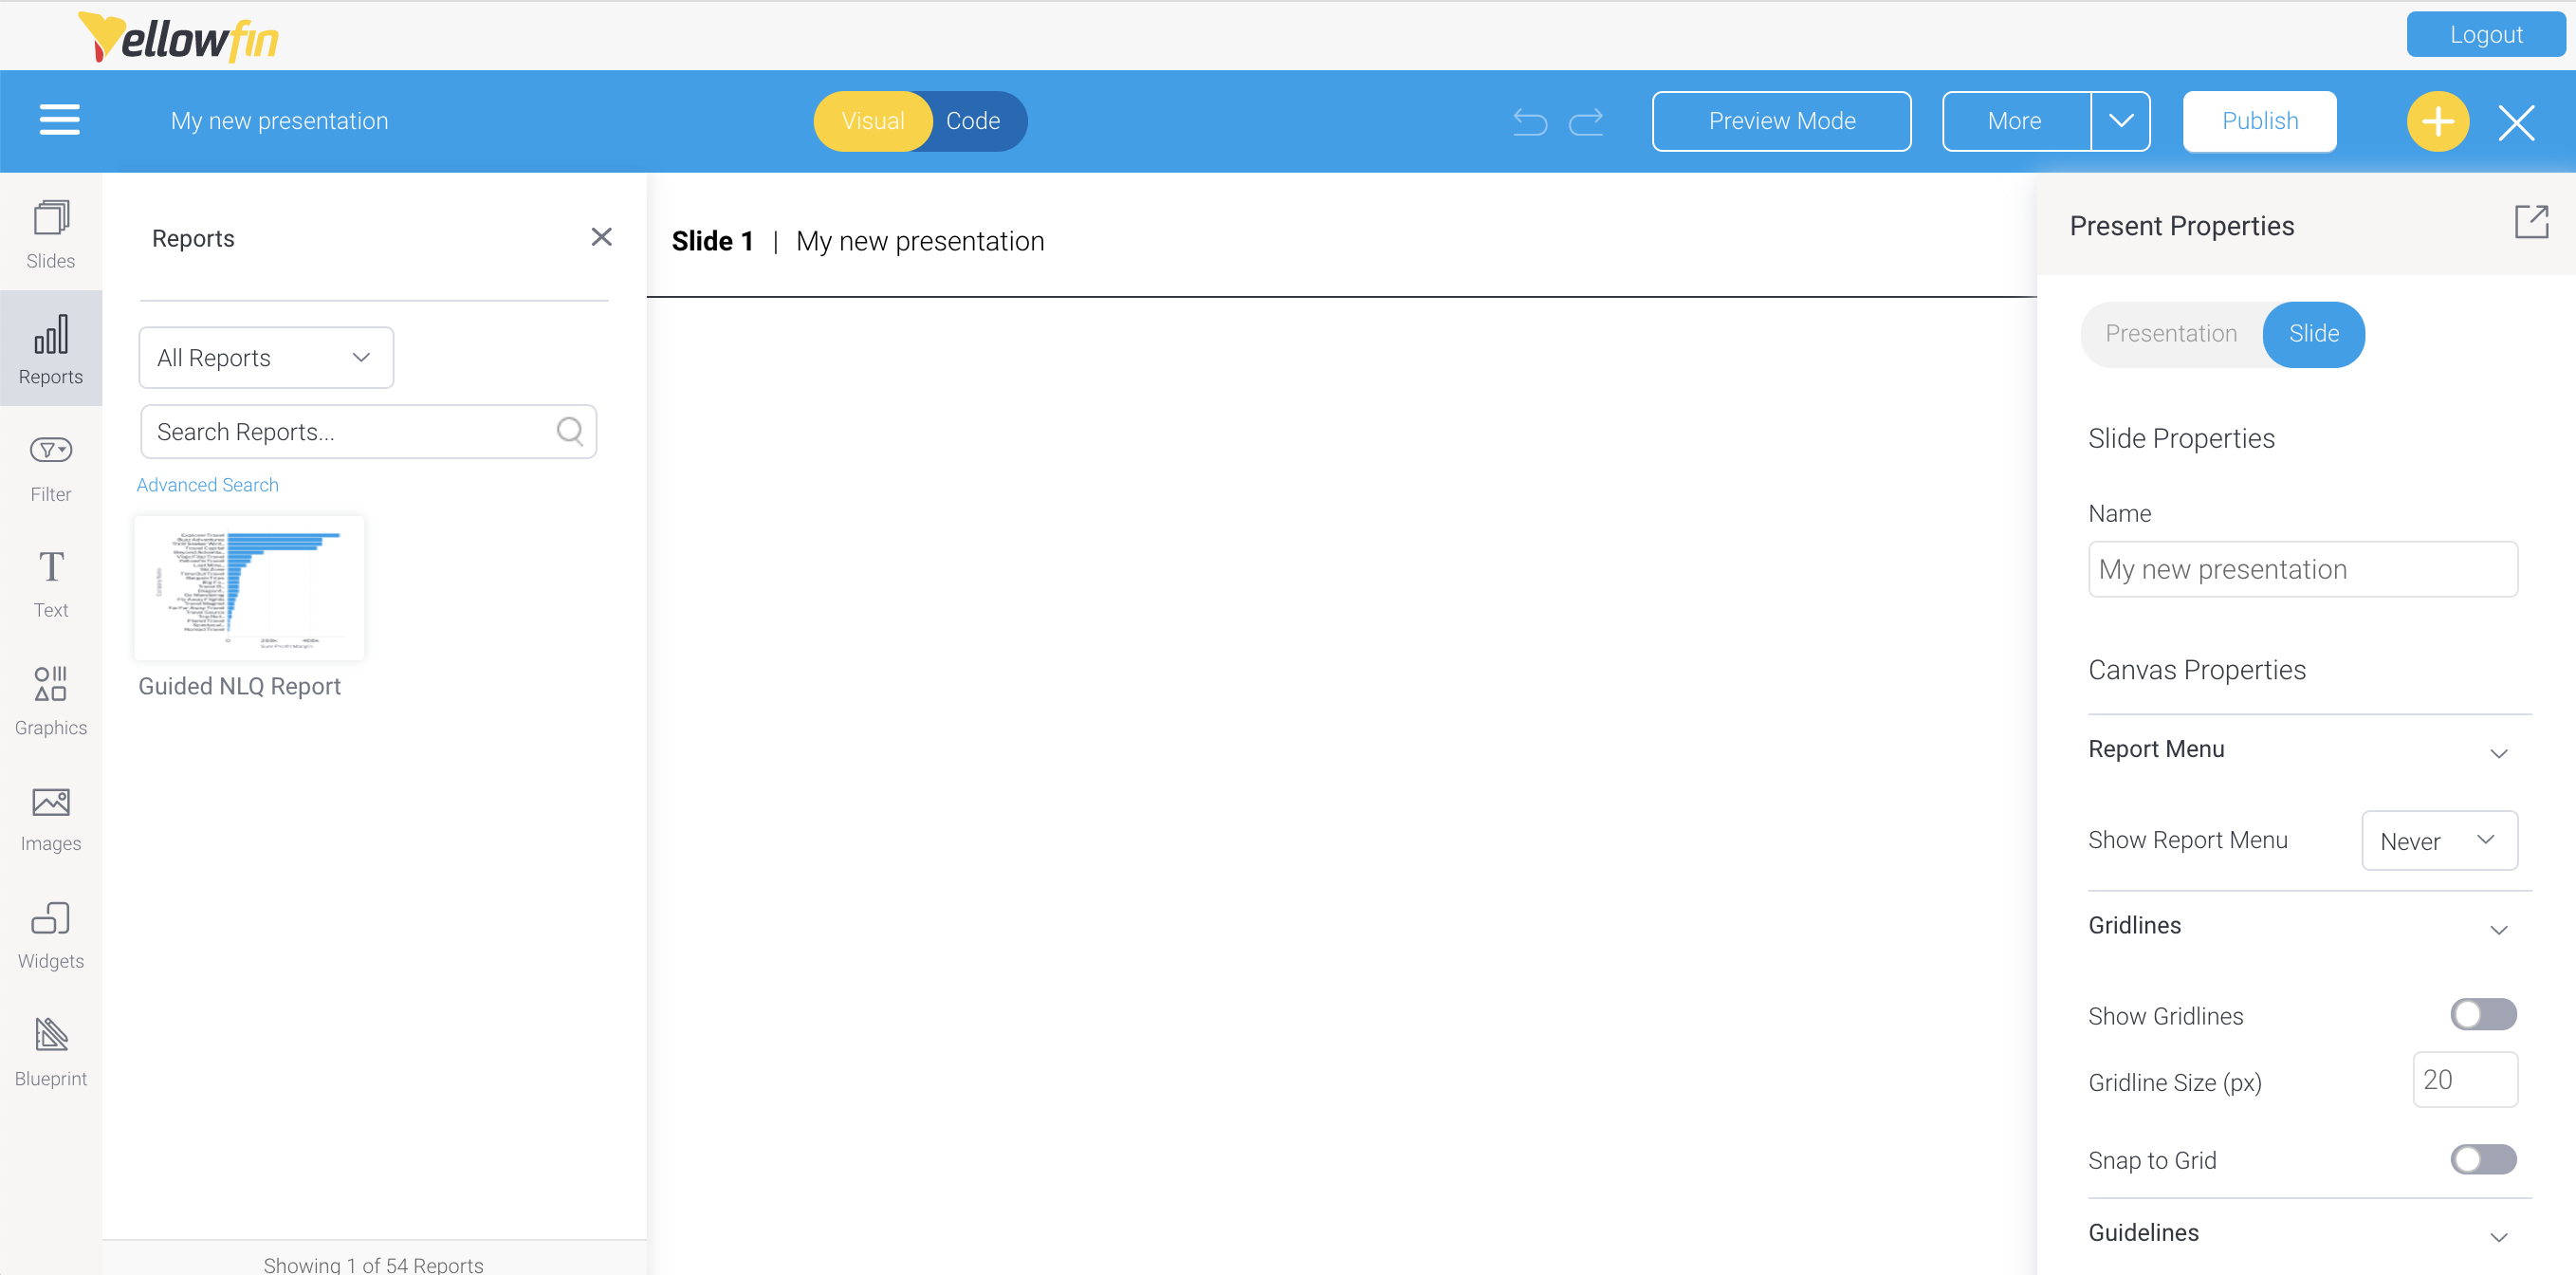
- Hover your mouse over the report and drag it to the presentation slide
- If you need further information about working with reports in presentations, see the wiki section for presentation creation