Page History
...
Object | Template | Description |
|---|---|---|
| Canvas & layouts | Add reports in the form of charts, canvas or tables to your dashboard. You can provide interactive reports, report bookmarks, snapshots, or entire report canvas. | |
| Canvas & layouts | Add report filters to filter data directly on the dashboard. | |
| Canvas & layouts | Add headlines or descriptive text. Customize it to match any text styling. | |
| Canvas | Add shapes, icons, or lines to further enhance your dashboard’s design. | |
| Canvas | Incorporate static images to your dashboard. | |
| Canvas | Add chart placeholders or quickly create simple charts directly on the dashboard. | |
| Canvas | Add custom or Yellowfin packaged code widgets. | |
| Action Buttons | Canvas | Add action buttons that trigger events upon clicking. |
...
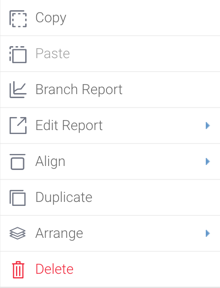
Right-click on any object to display a menu of actions you can perform on it. Alternatively, you can click on the 
| Section | ||||||||||||||||||||||||
|---|---|---|---|---|---|---|---|---|---|---|---|---|---|---|---|---|---|---|---|---|---|---|---|---|
|
...