Page History
| Anchor | ||||
|---|---|---|---|---|
|
| Table of Contents | ||
|---|---|---|
|
Overview
| Styleclass | ||
|---|---|---|
| ||
...
Option | Description |
|---|---|
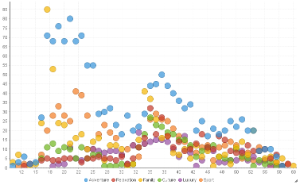
Horizontal Axis | Select the metric or date to use as the x axis measurement. |
Vertical Axis | Select the metric or date to use as the y axis measurement. |
Size | Optional: Select a metric to set the size of each bubble. |
Colour | Optional: You can select one field to split your values by colour. |
Scatter Chart Tutorial
| Styleclass | ||
|---|---|---|
| ||
Summary
In order to set up a Scatter Chart you will need:
...
| Section | ||||||||||
|---|---|---|---|---|---|---|---|---|---|---|
|
| horizontalrule |
|---|
| Styleclass | ||
|---|---|---|
| ||