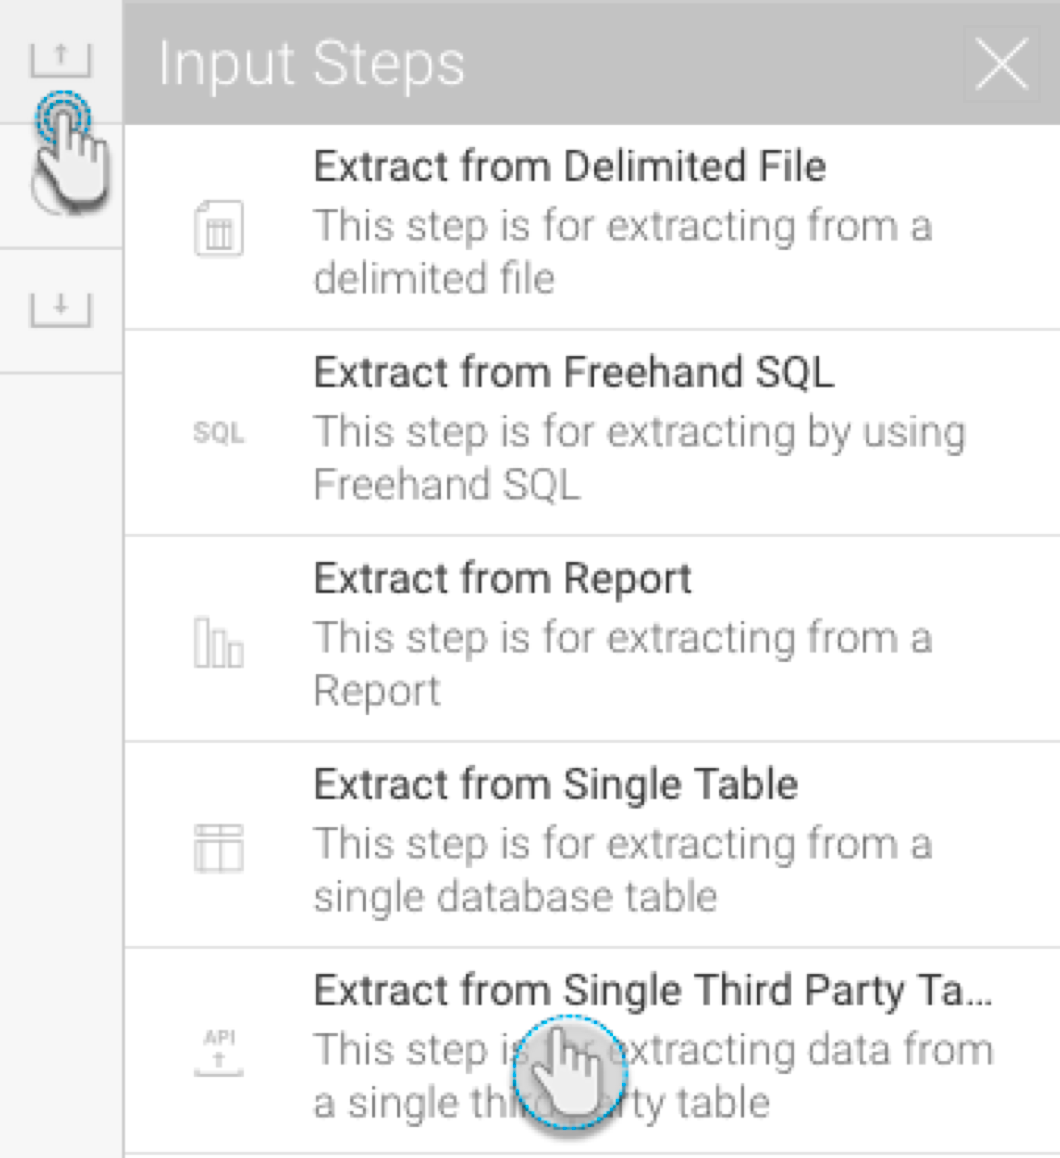
Overview
The Data Transformation module supports different ways of extracting data from sources and loading it into Yellowfin, using the input steps. This section will show you how to use and configure each of these steps.

Icon | Input source | Description |
This input method is used when extracting data from a delimited file (that is, a file with separators). | ||
Use this method to import data from a database using an SQL query. | ||
Use this method to use a Yellowfin report as the source of data. | ||
This input step can be used to import data from a single database table. | ||
To extract data from a third-party connector, such as Twitter, Facebook, Google Analytics, etc. |
Configuring Input Steps
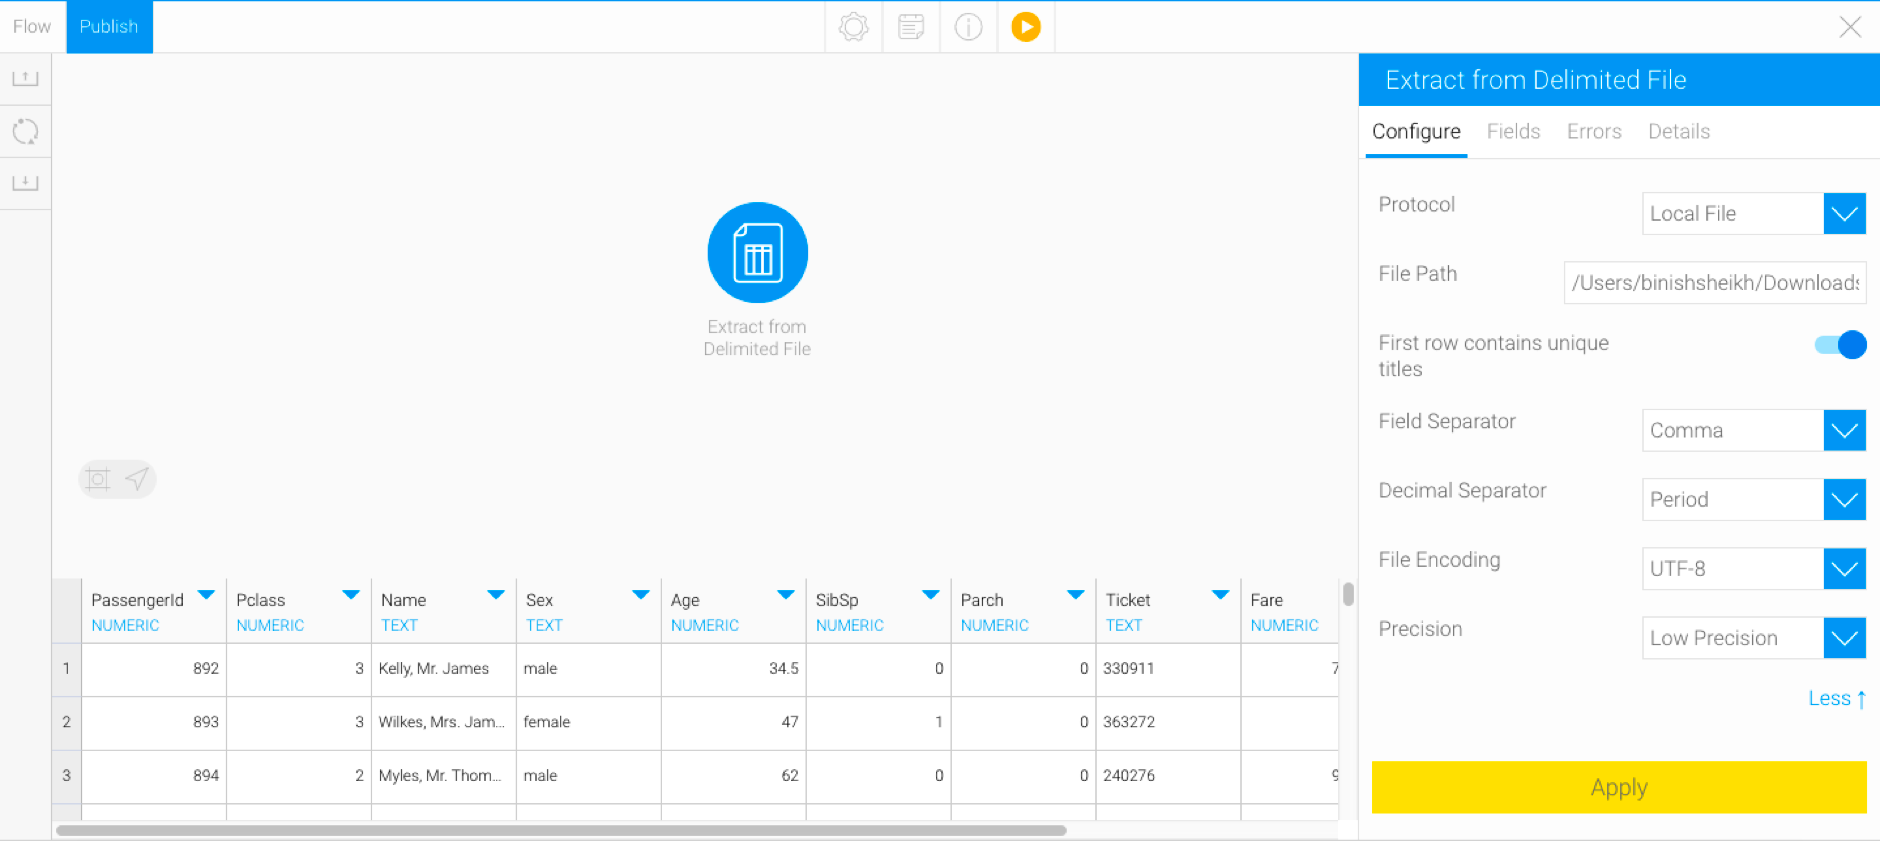
Delimited File
- Drag the Delimited File option from the input step list.

Configure the step to extract data from the file. Use the table below to understand the different fields in the Configure panel.

Then click Apply. Data extracted from the file will appear in the data preview panel.
Freehand SQL
- Drag the Freehand SQL option.

- Select the data source that you want to use.
- Write a SQL query to extract the required data.
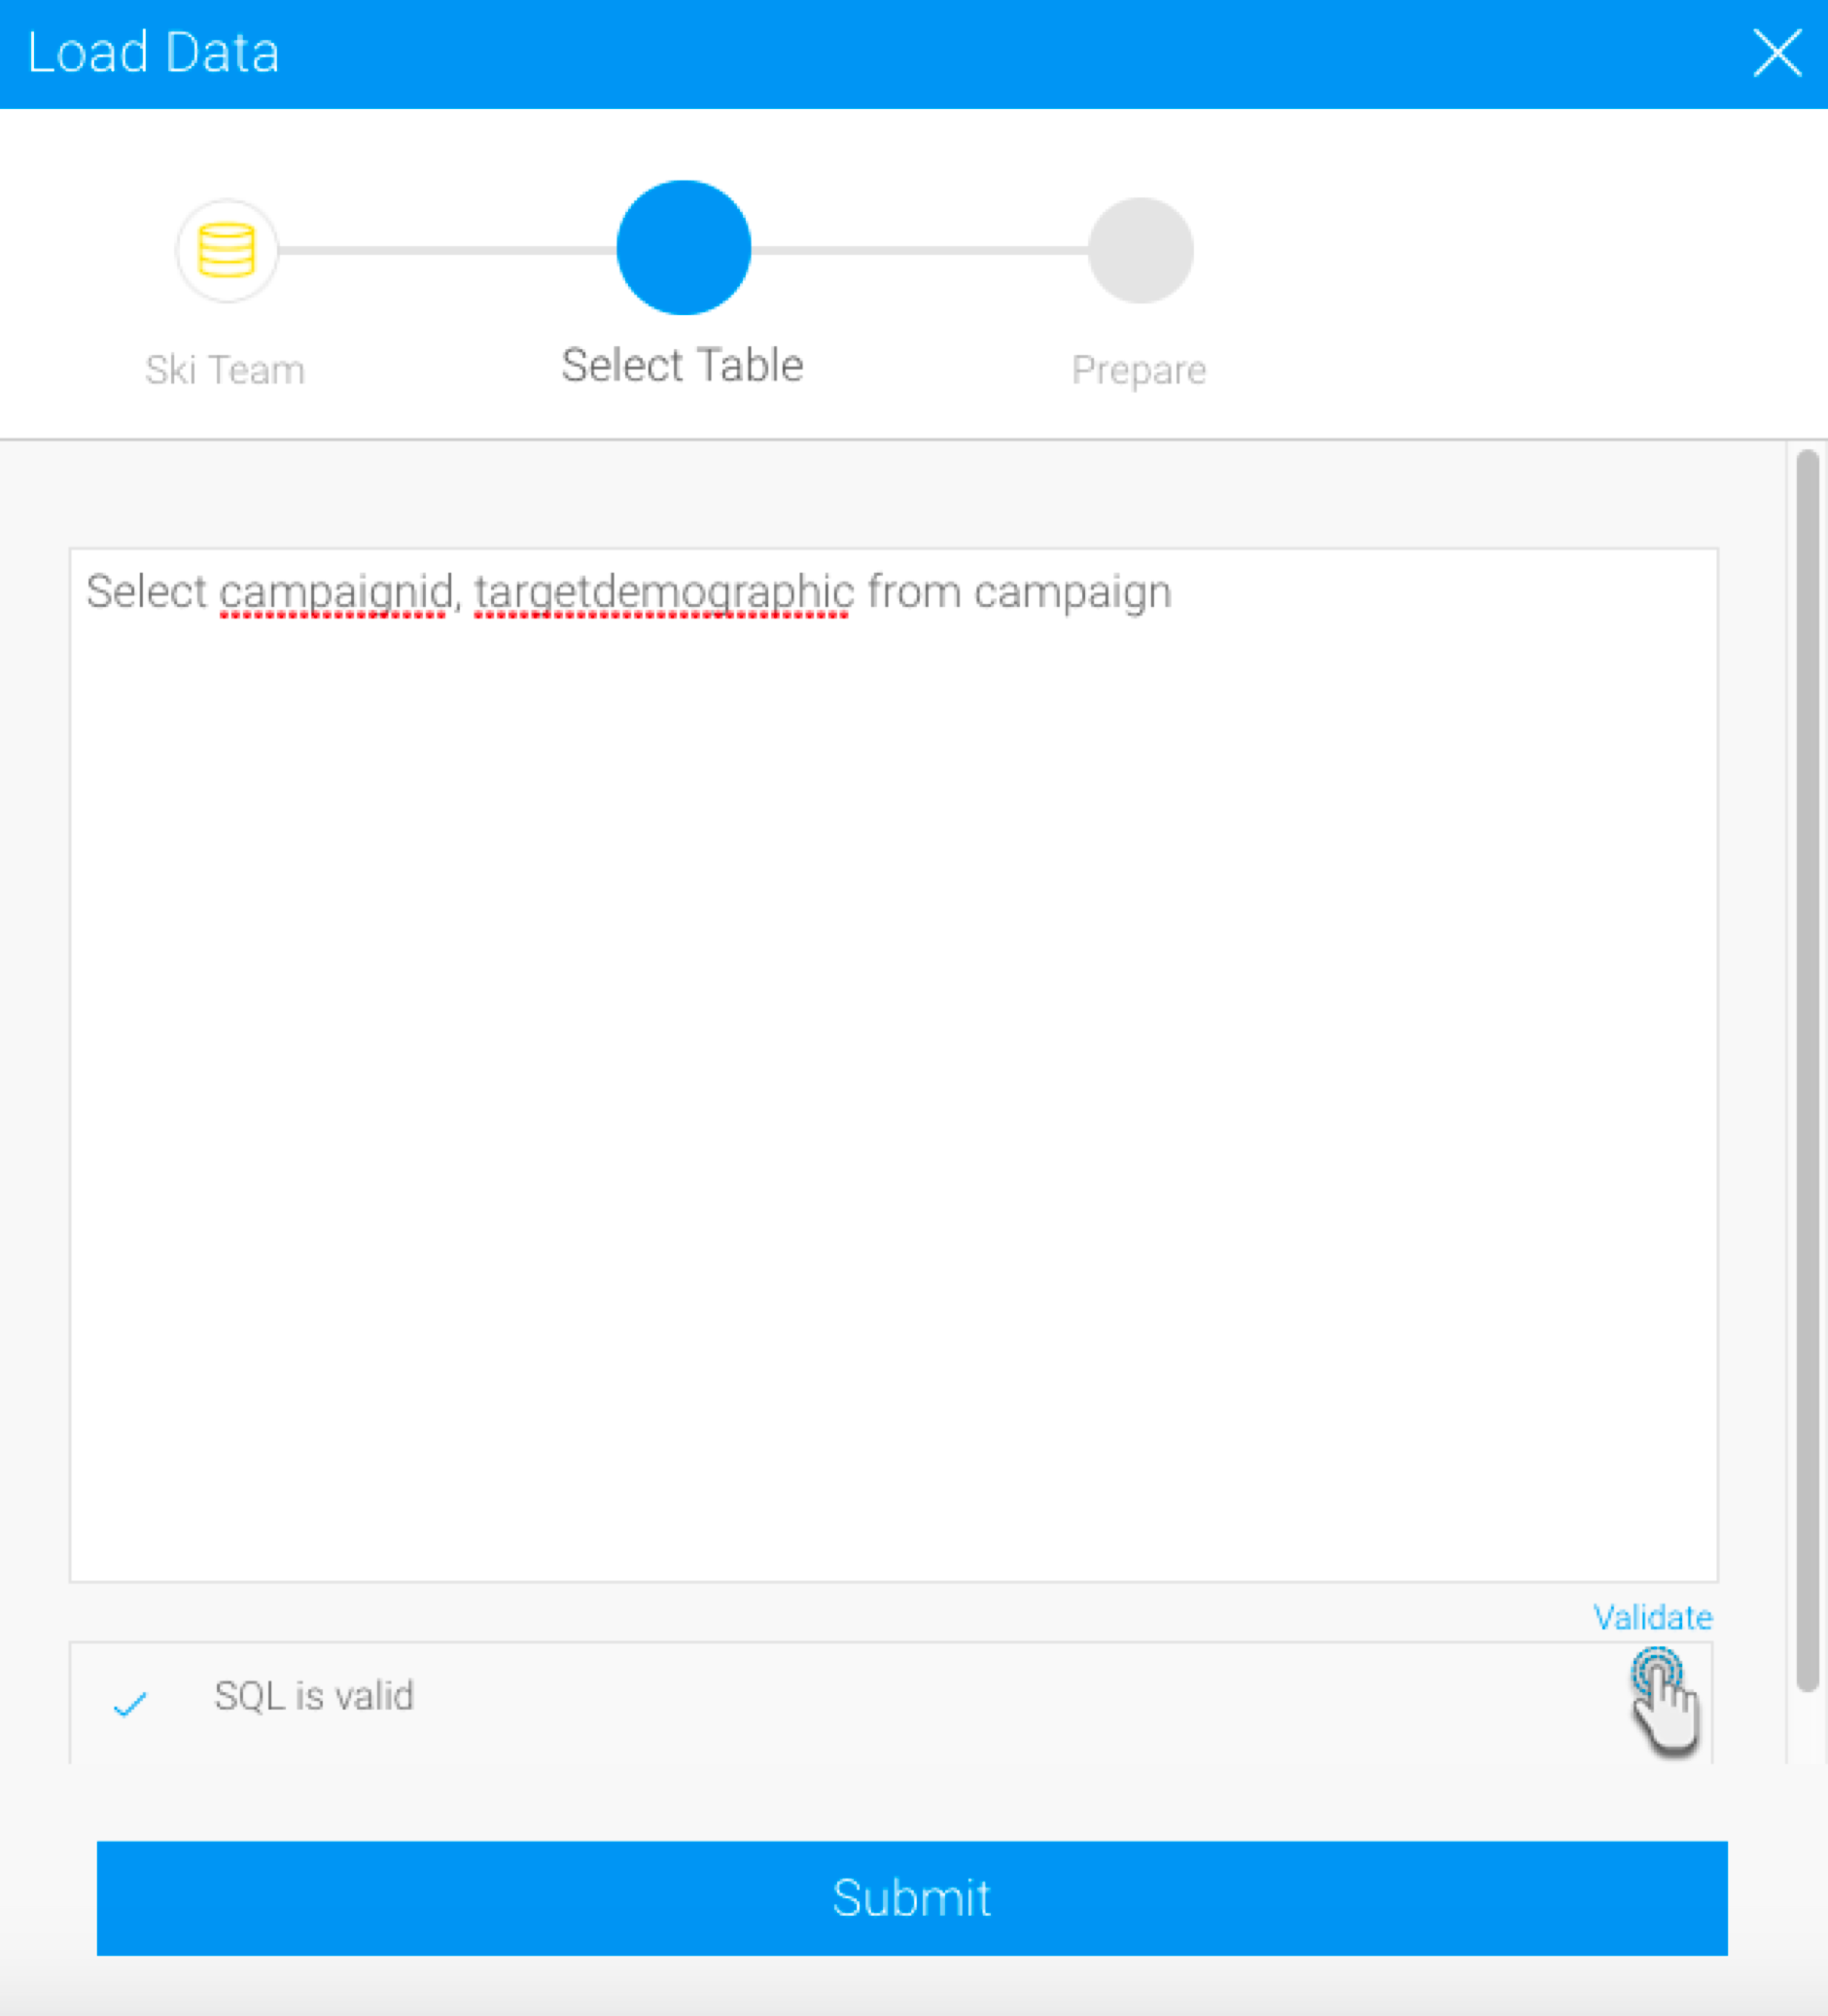
- You can click on the Validate option to check the validity of the SQL you provided. This ensures there are no errors in the query.
- Click on the Submit button when you are sure your query is correct.
- Then click on Apply in the Configure panel. The extracted data will appear in the data preview panel.
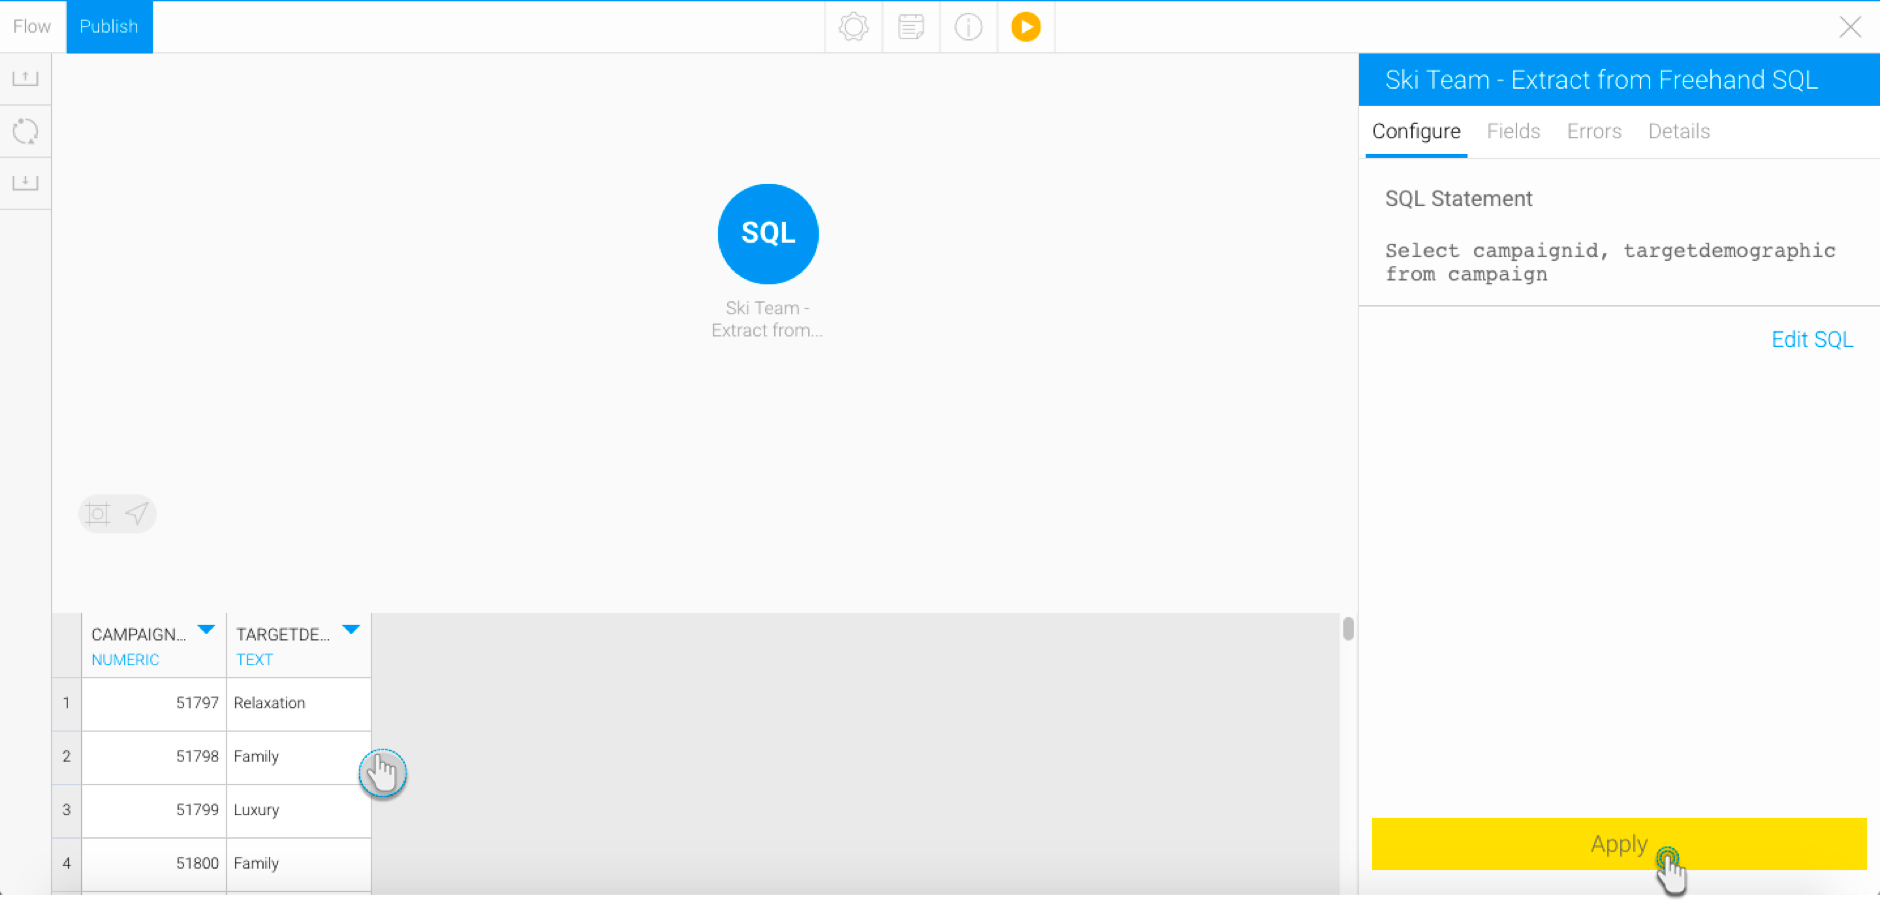
- To change the freehand SQL query, click the Edit SQL option in the Configure panel.
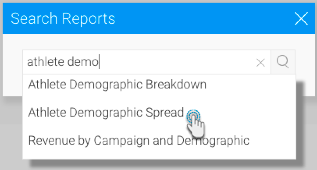
Report
- Drag the Report input step onto the transformation canvas.
- Search for the report that you want to extract data from, by entering and then clicking on its name.
- Once a report is selected, its column field names will be displayed.
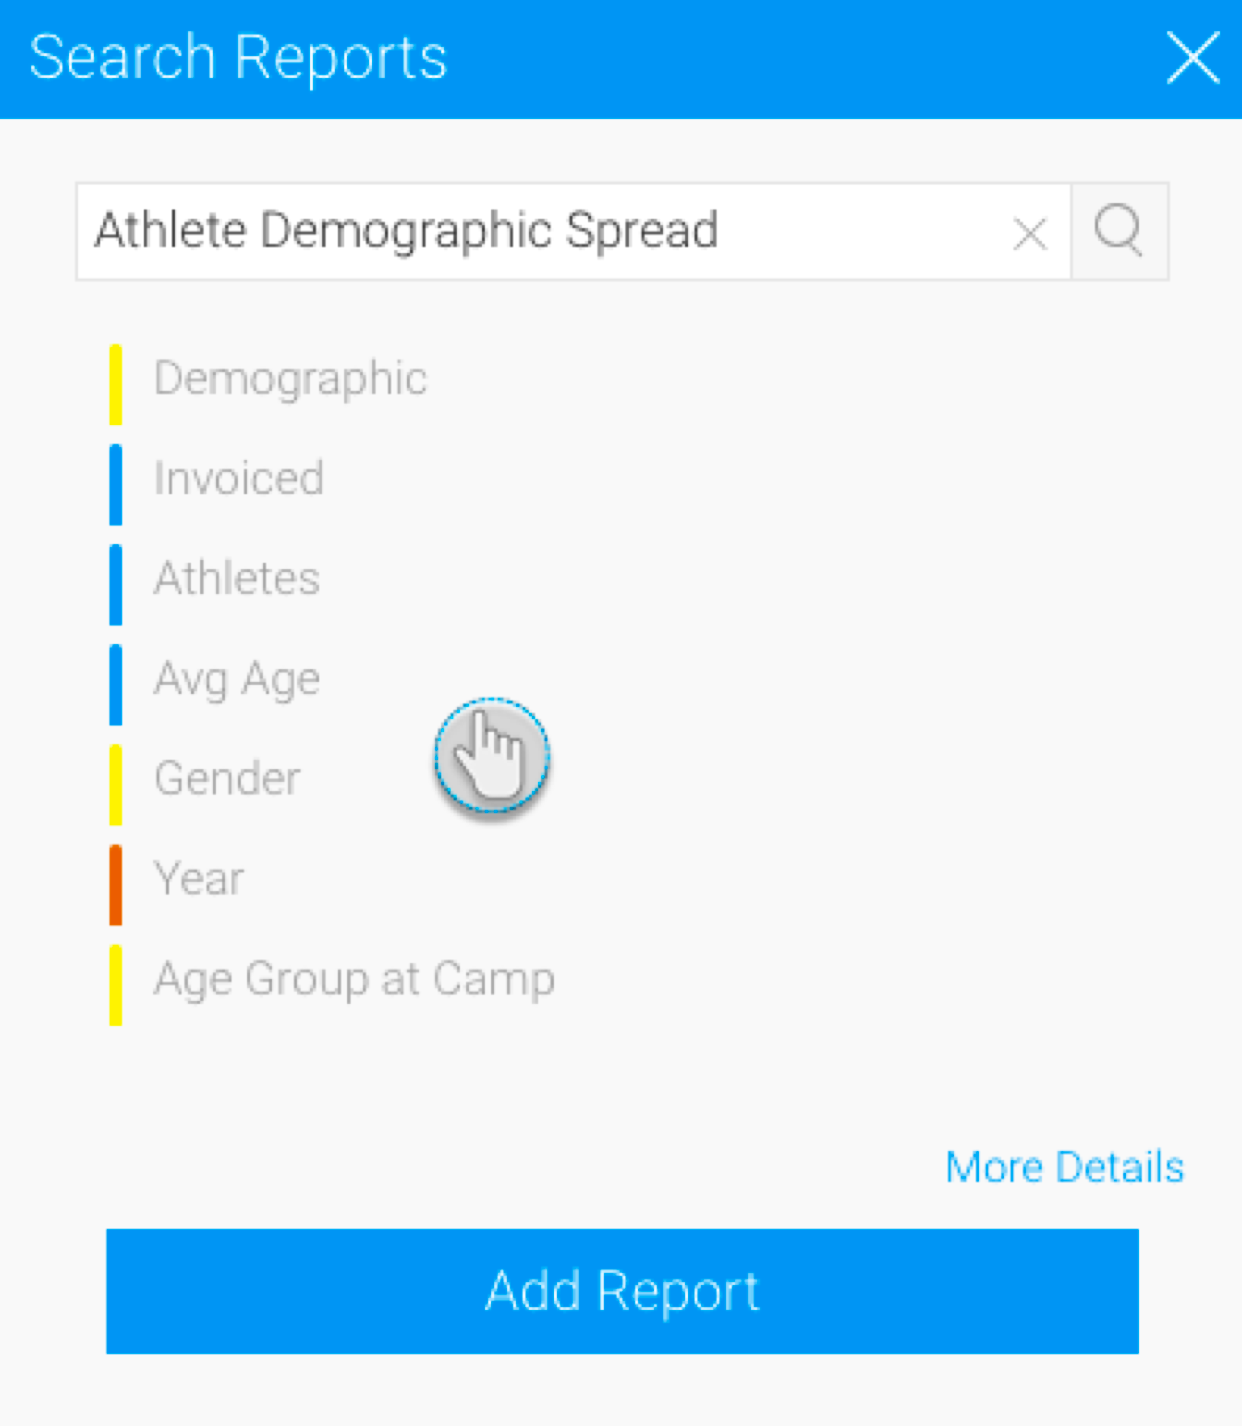
- Click on the Add Report button.
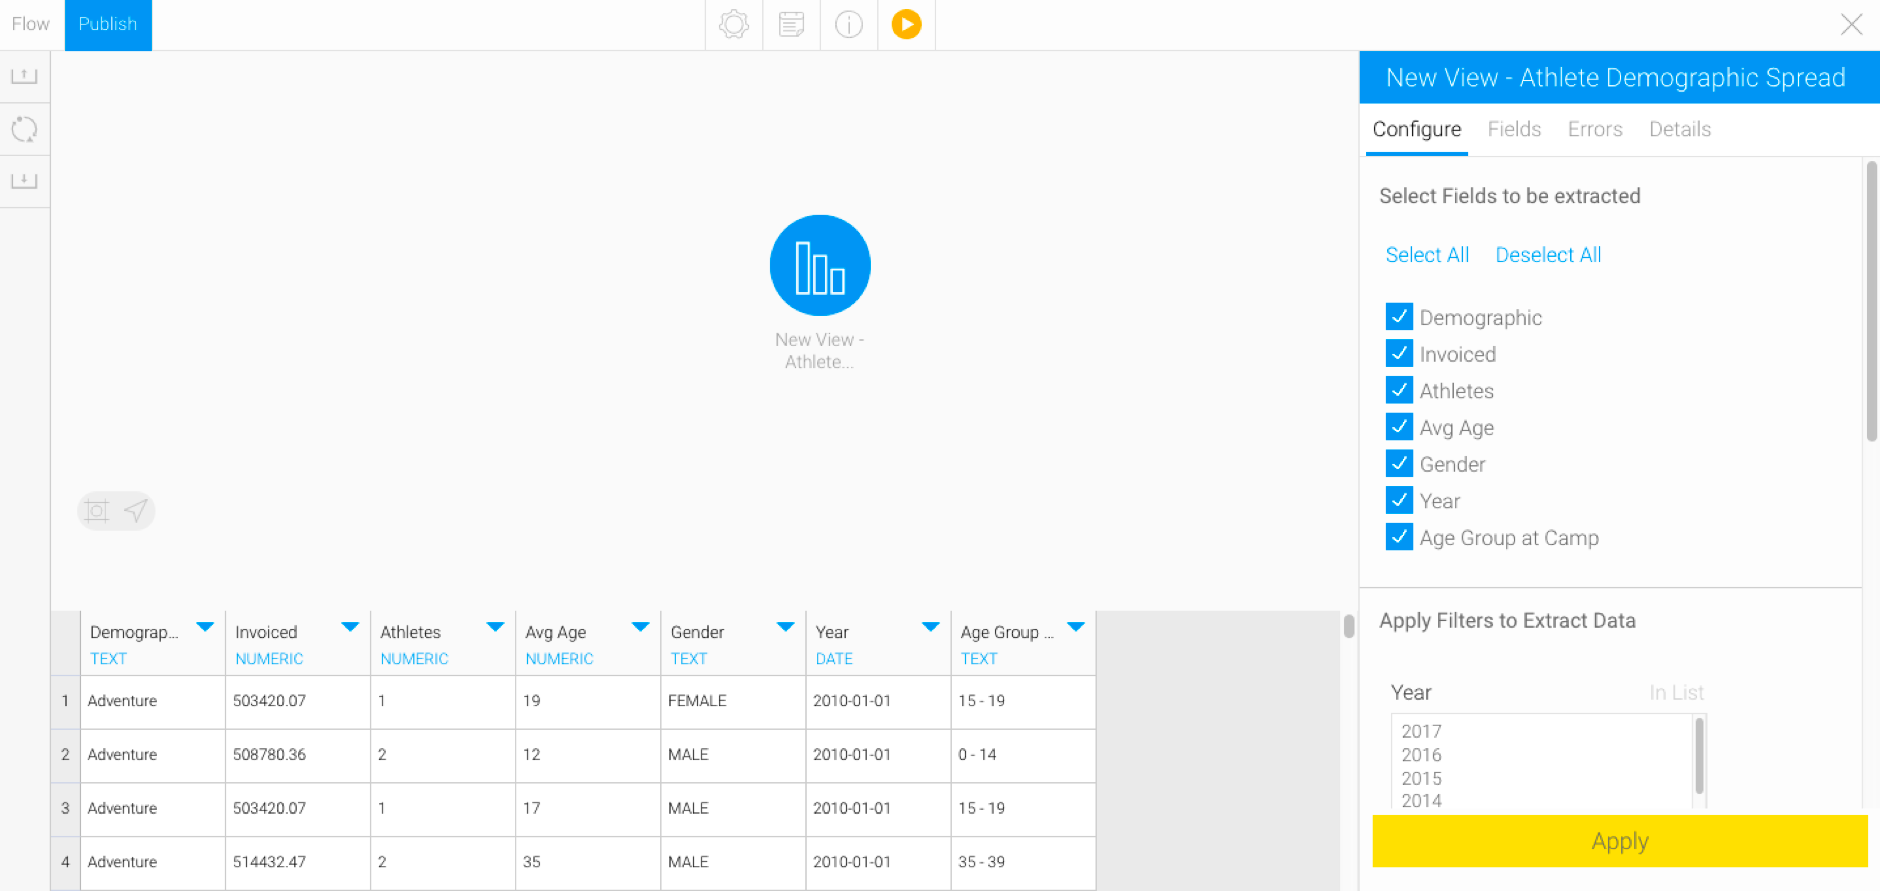
- The report fields can be customized in the Configure panel.
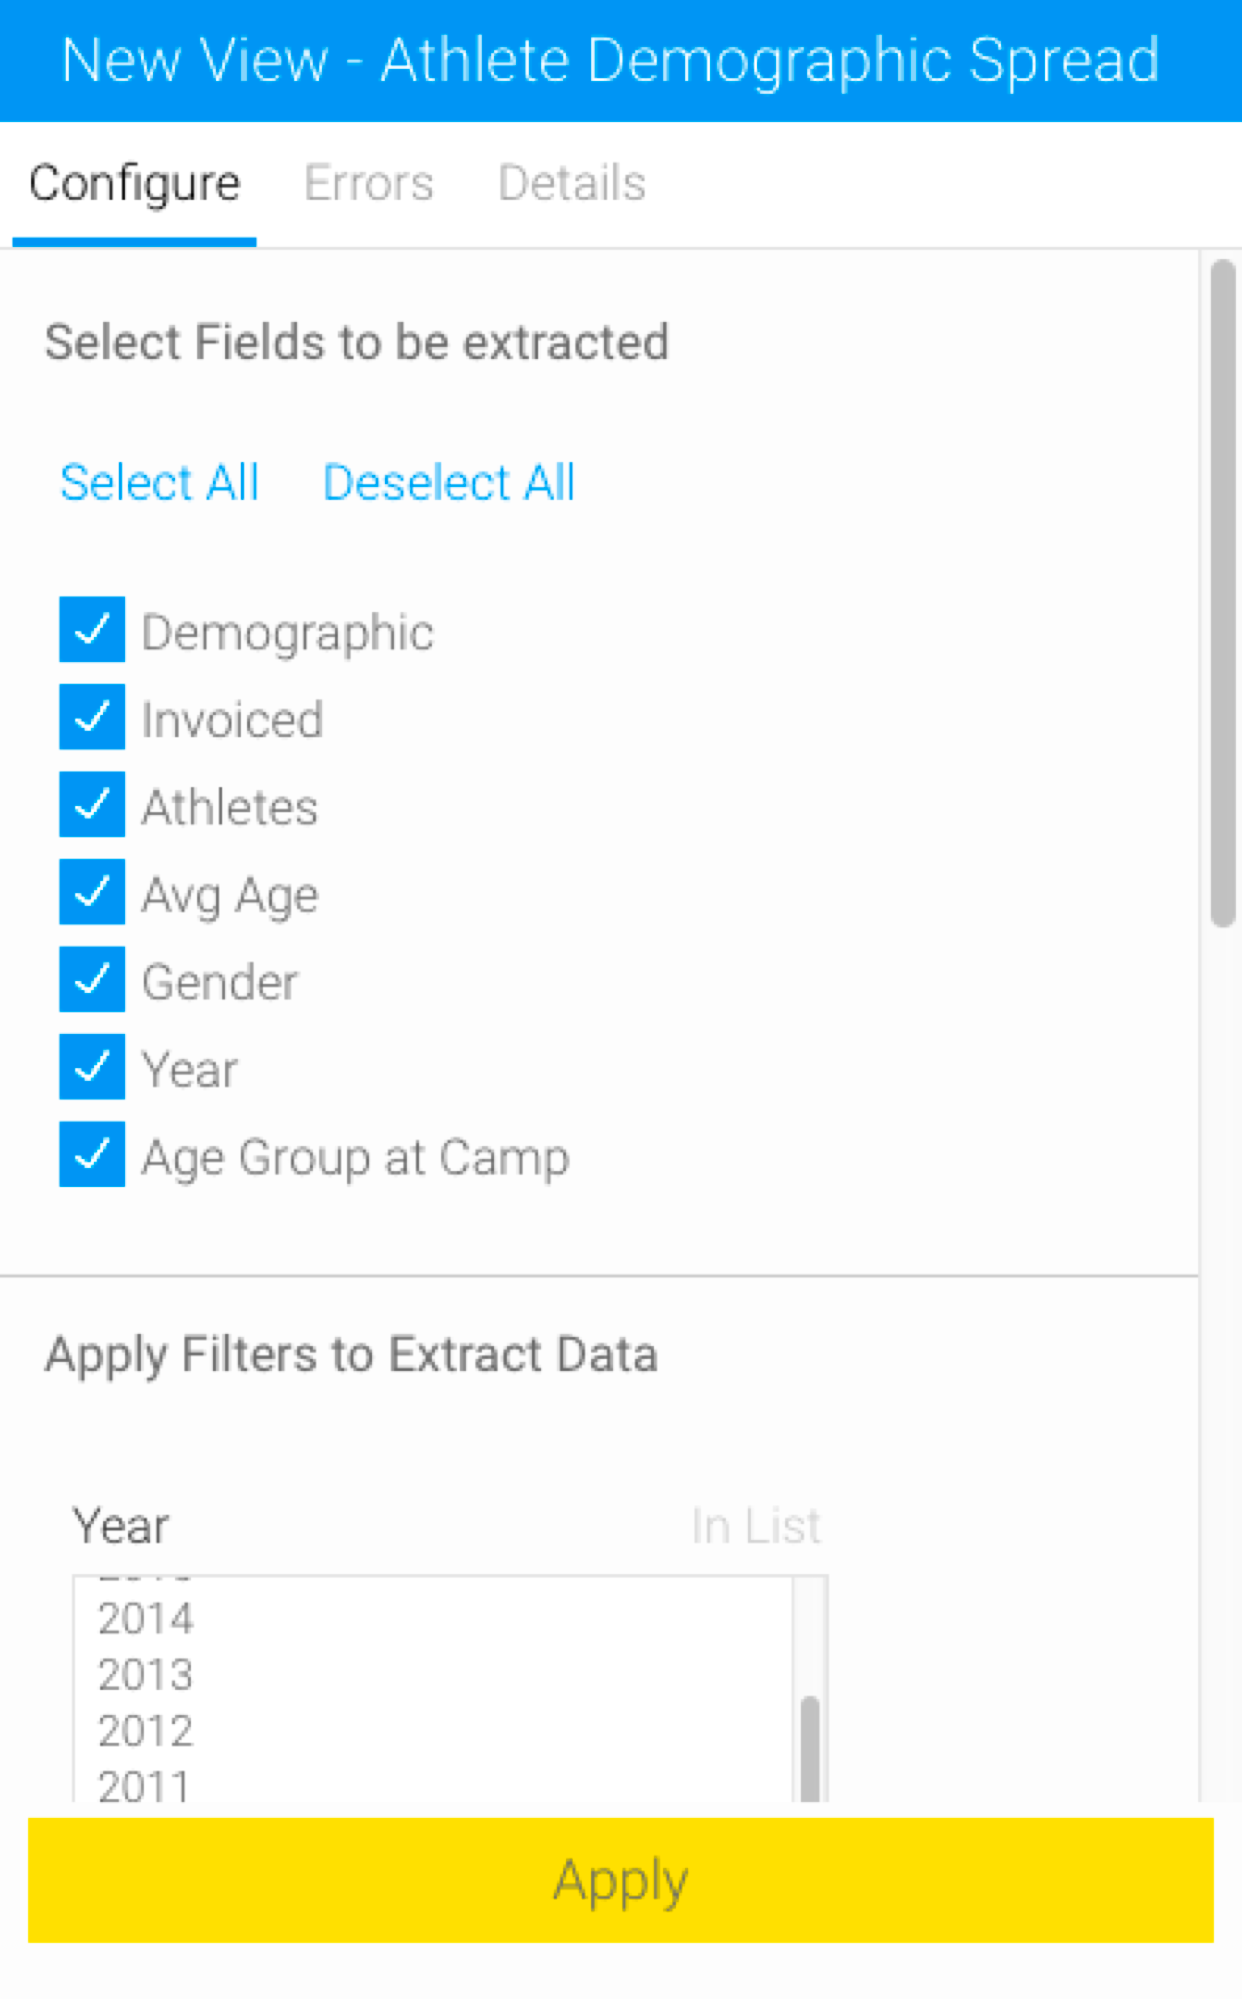
- You can remove fields that you don’t want included.
- If the report has any embedded filters, they will also appear here. You can apply these filters when extracting data.
- Then click Apply. You can see the extracted data from the report in the data preview panel.
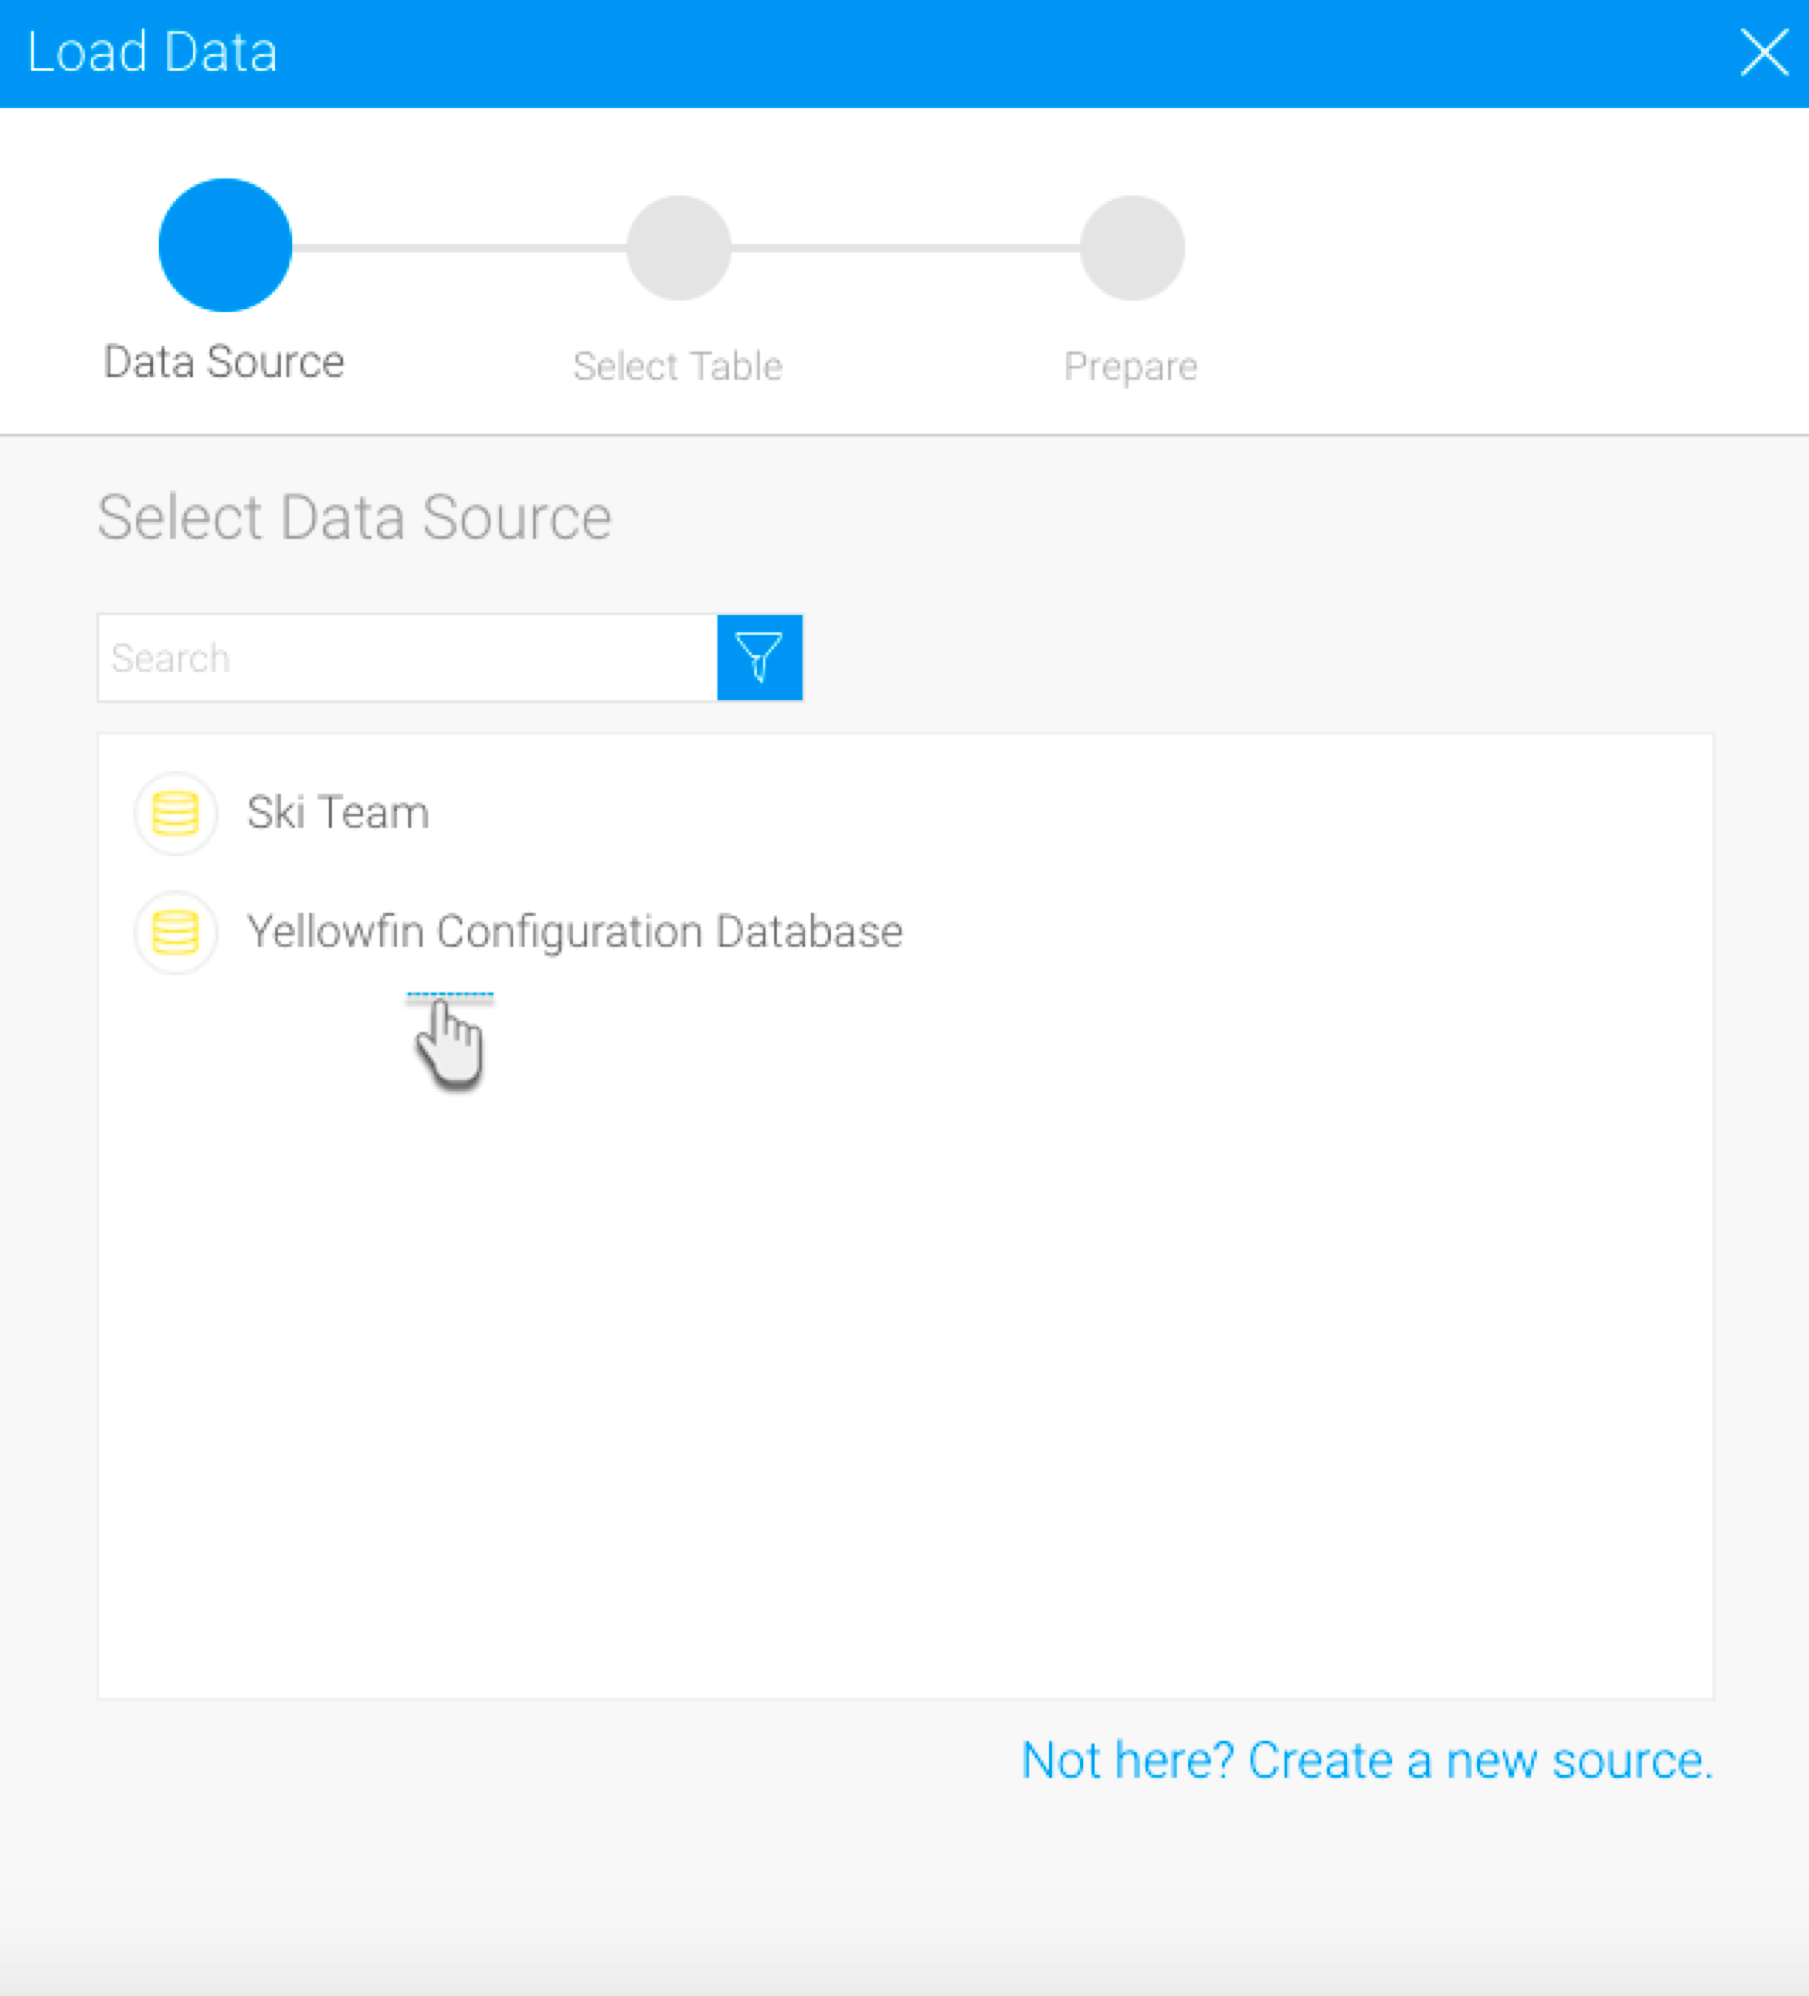
Single Database Table
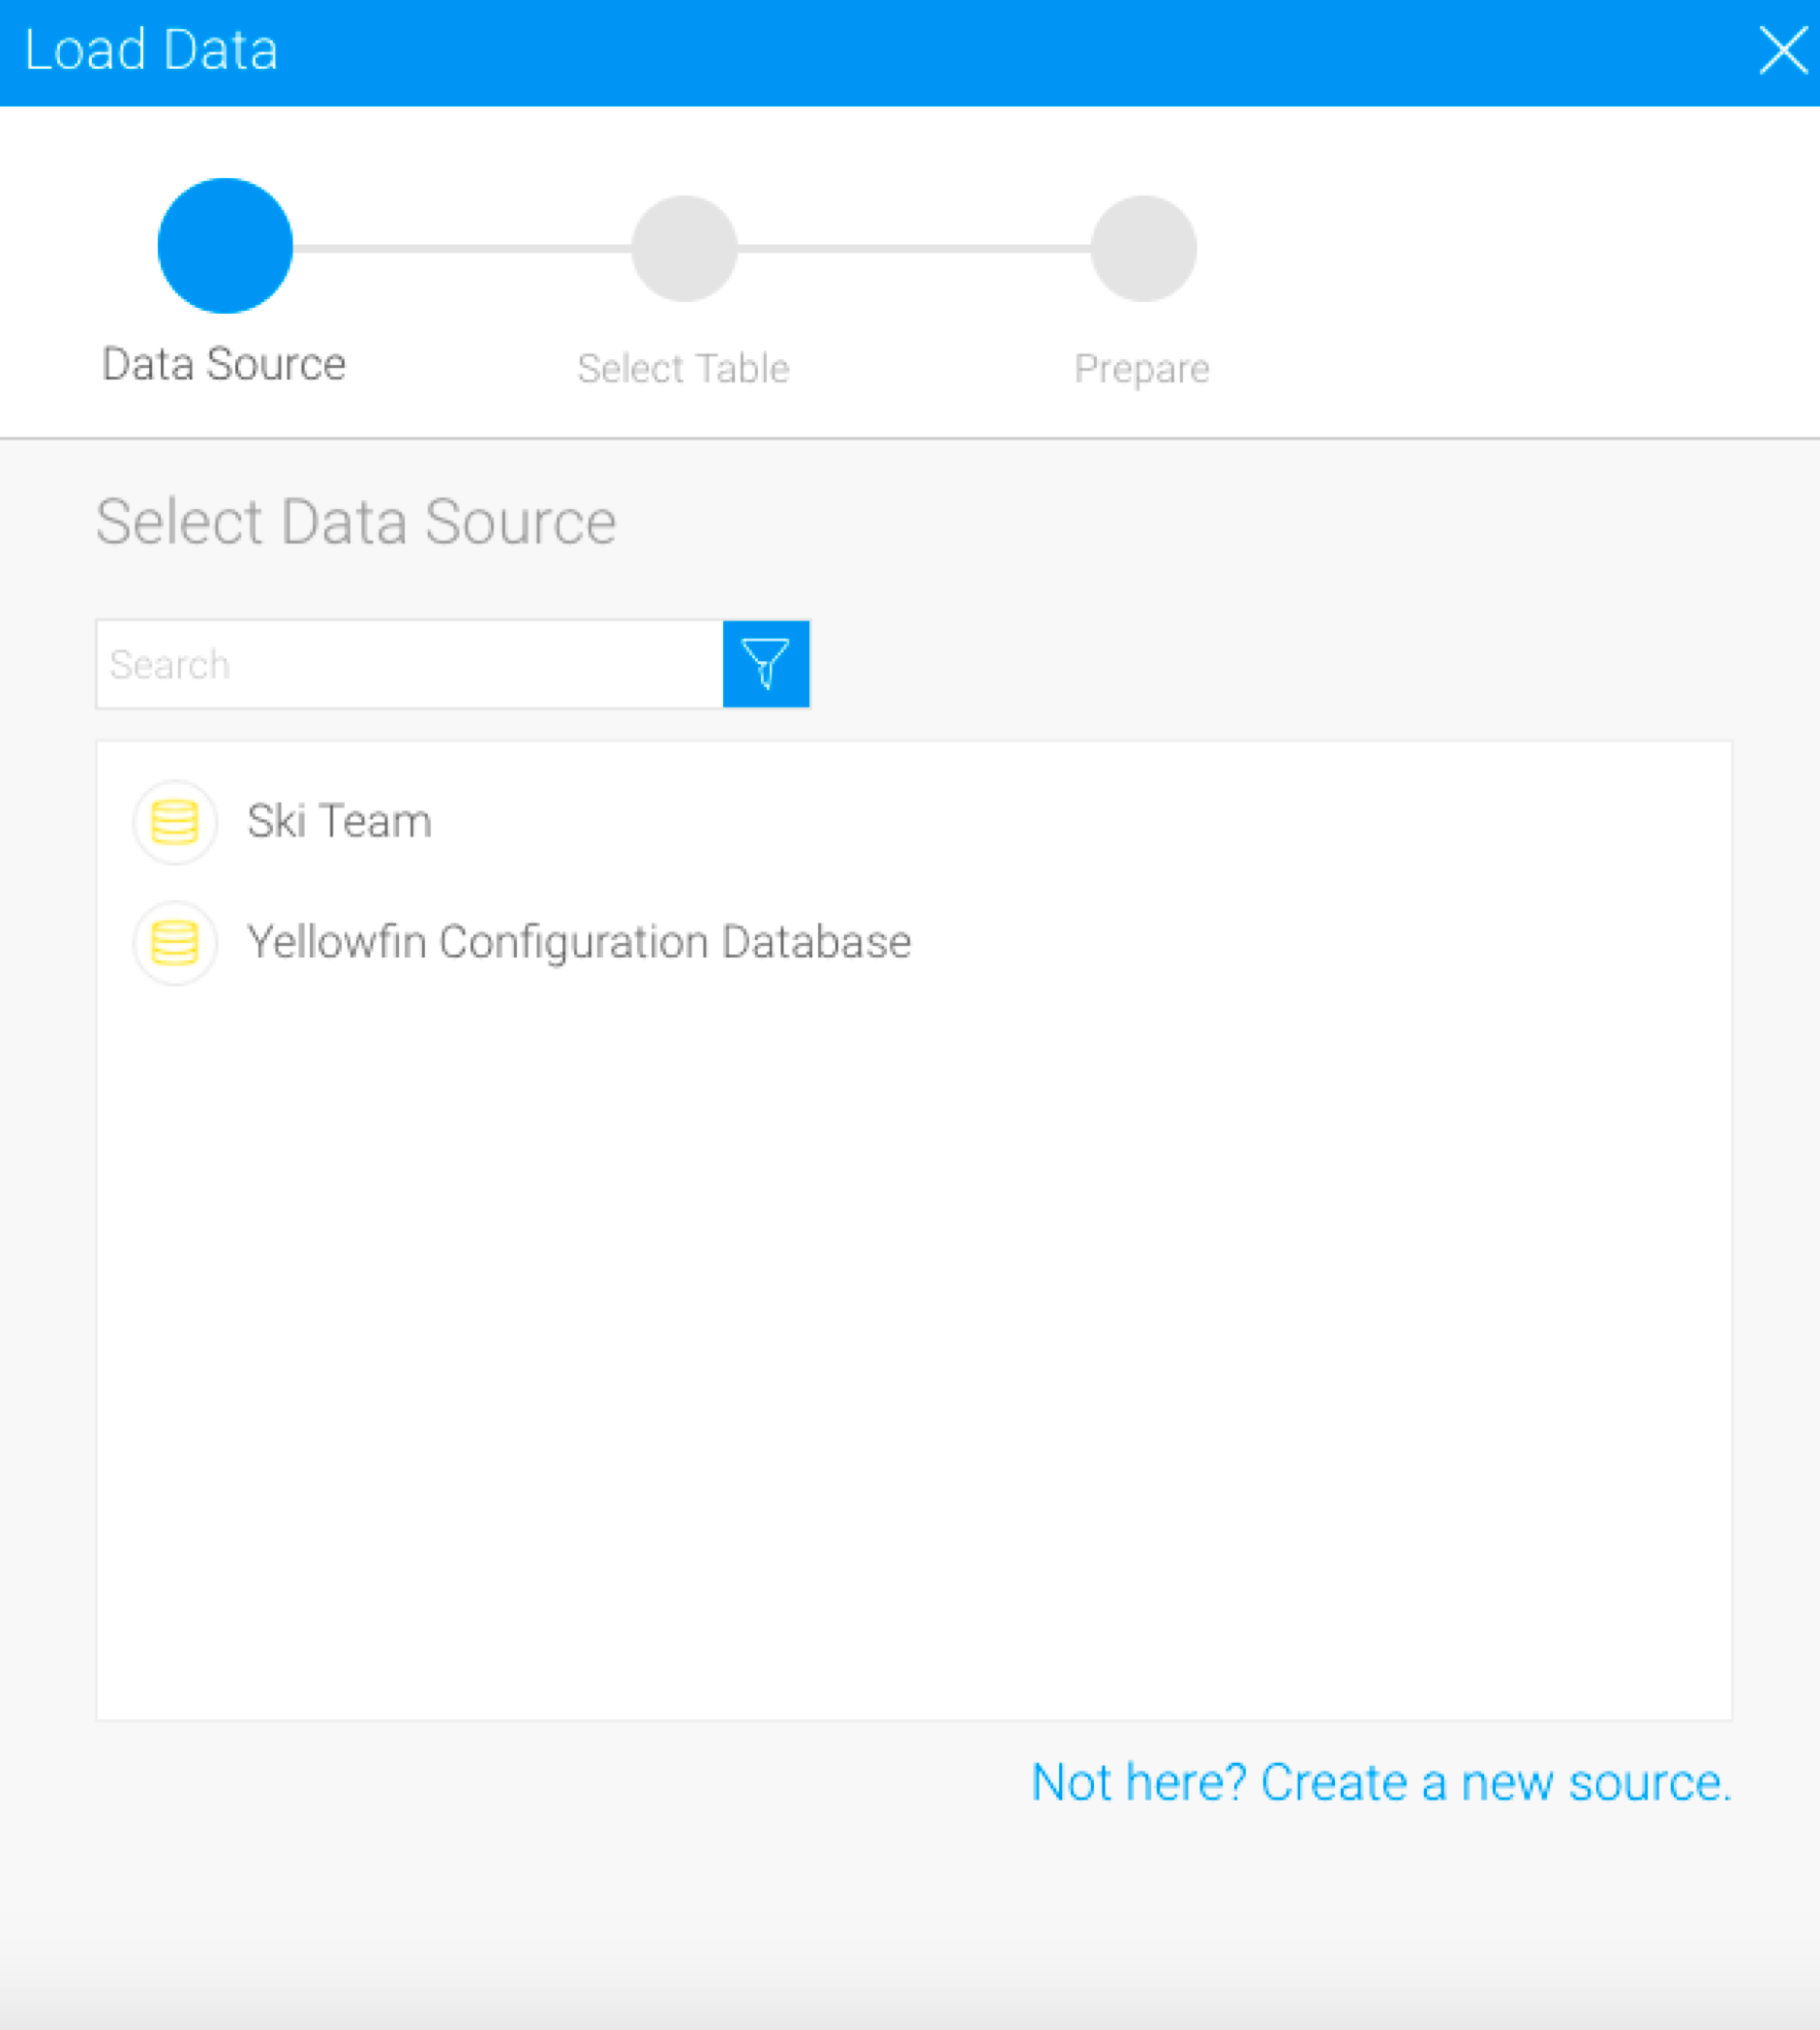
Drag the Single Table option onto the canvas.

On the appearance of the popup, select the database you want to use.
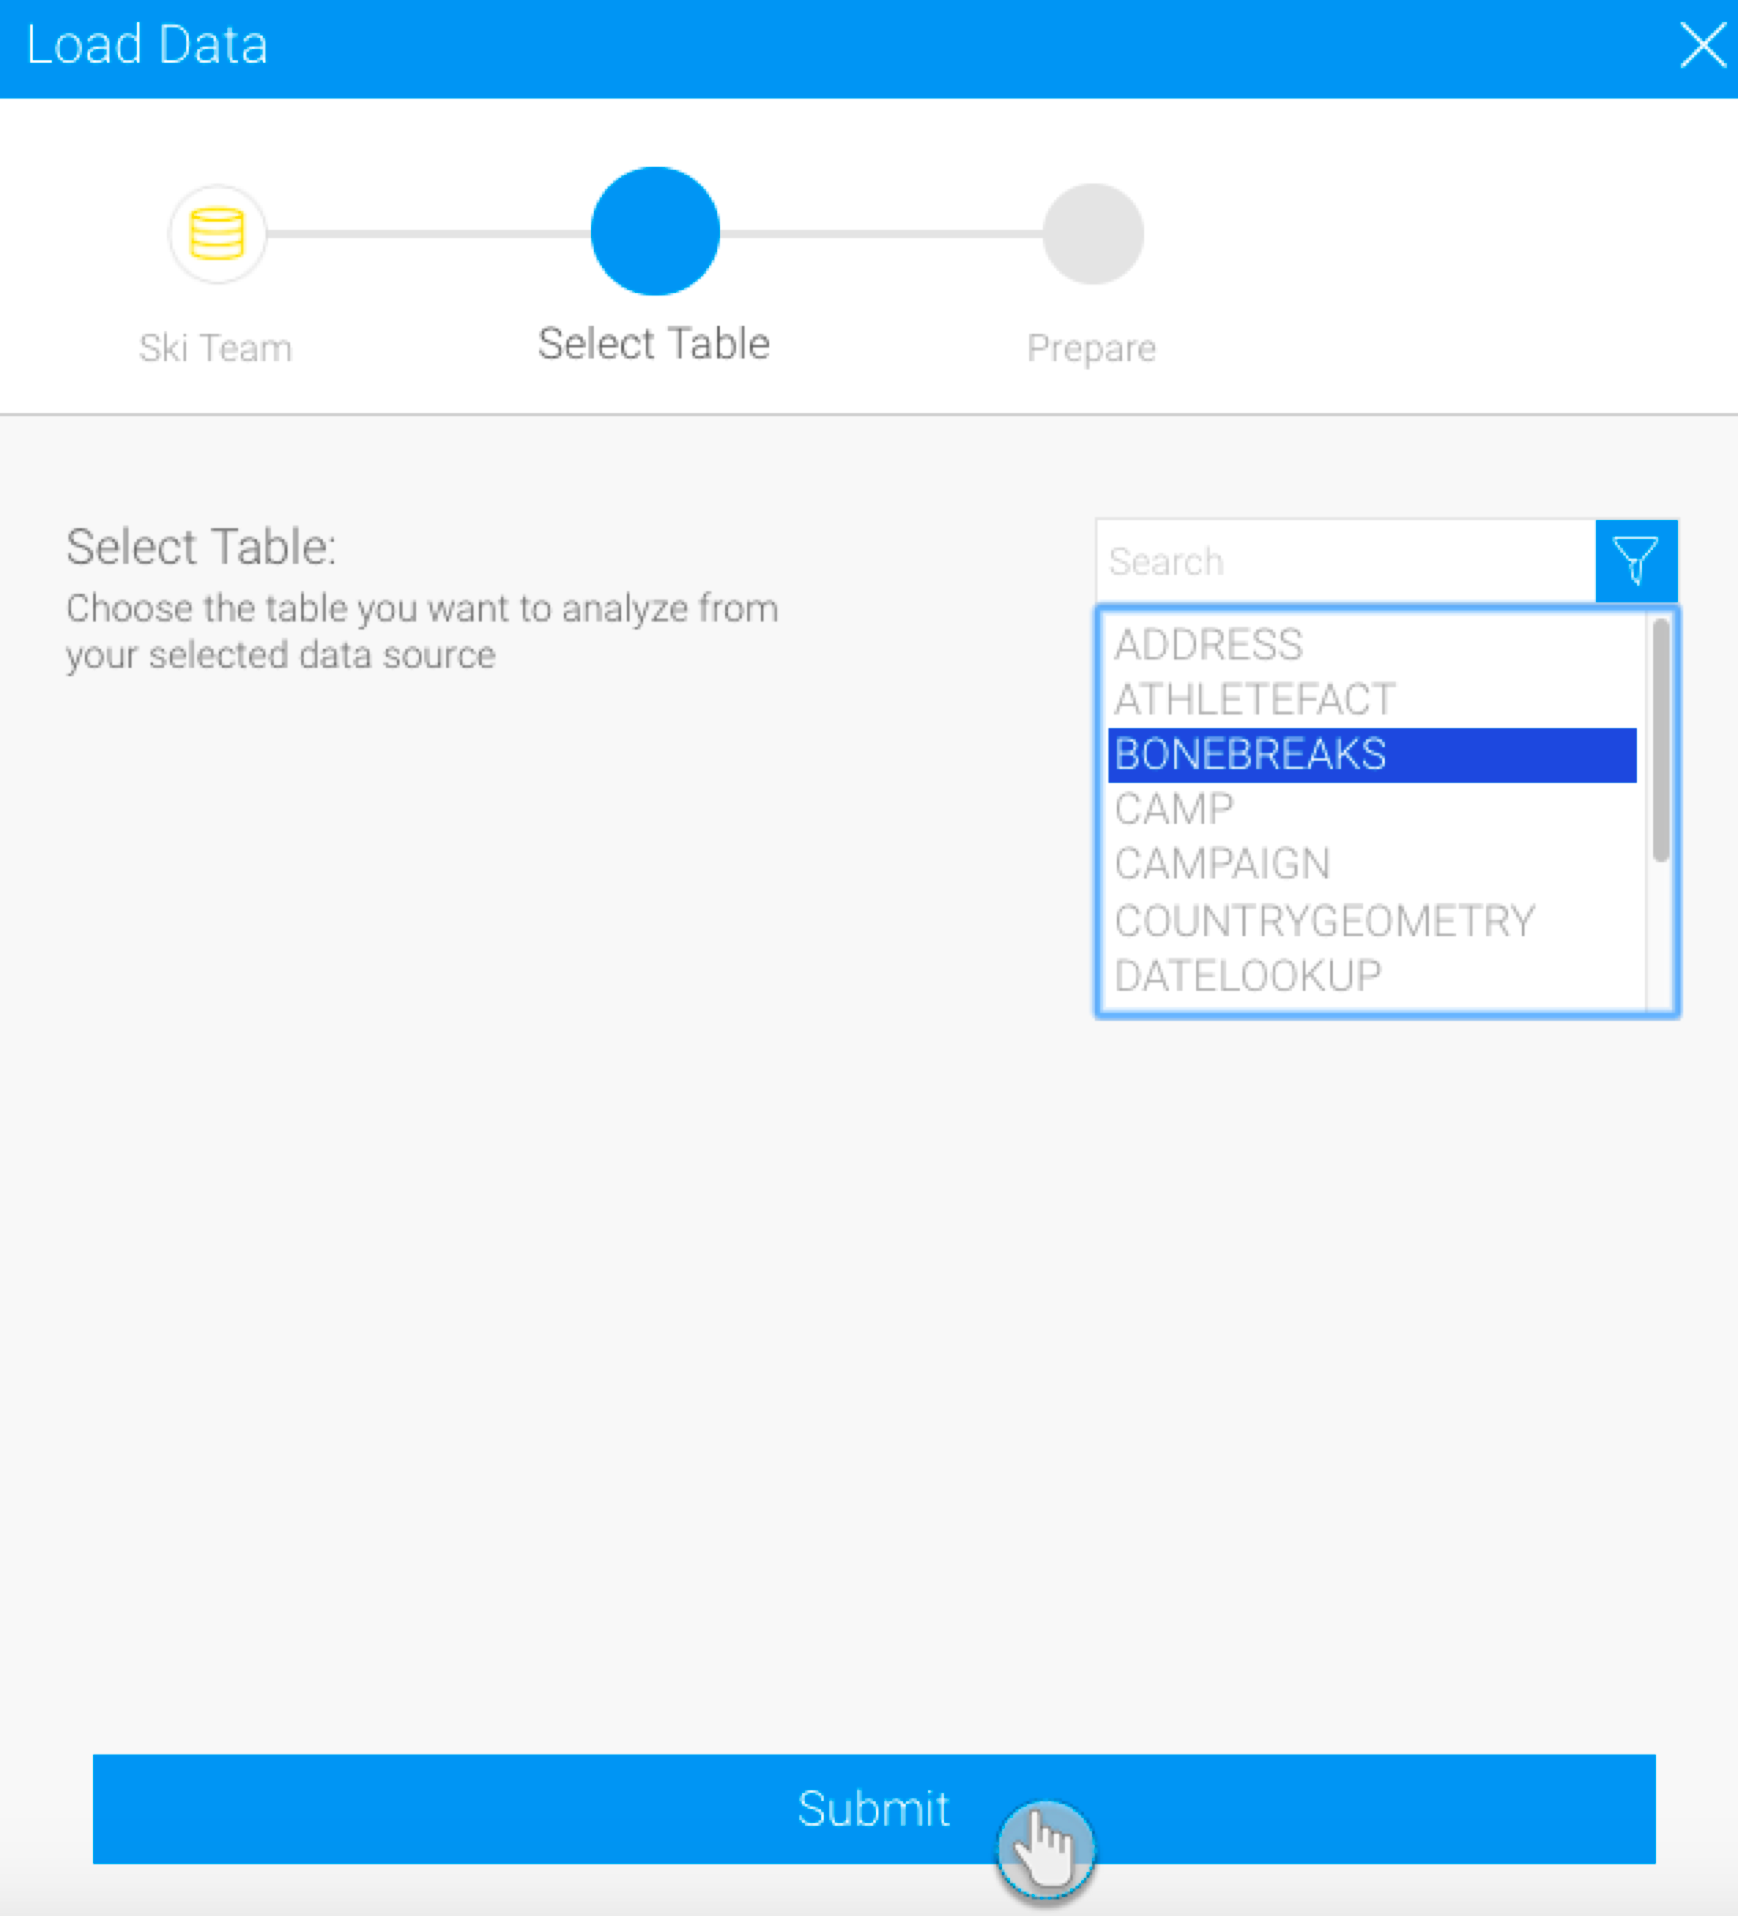
Then choose a table. And click on the Submit button.
The details of this step can be configured through the configure panel.
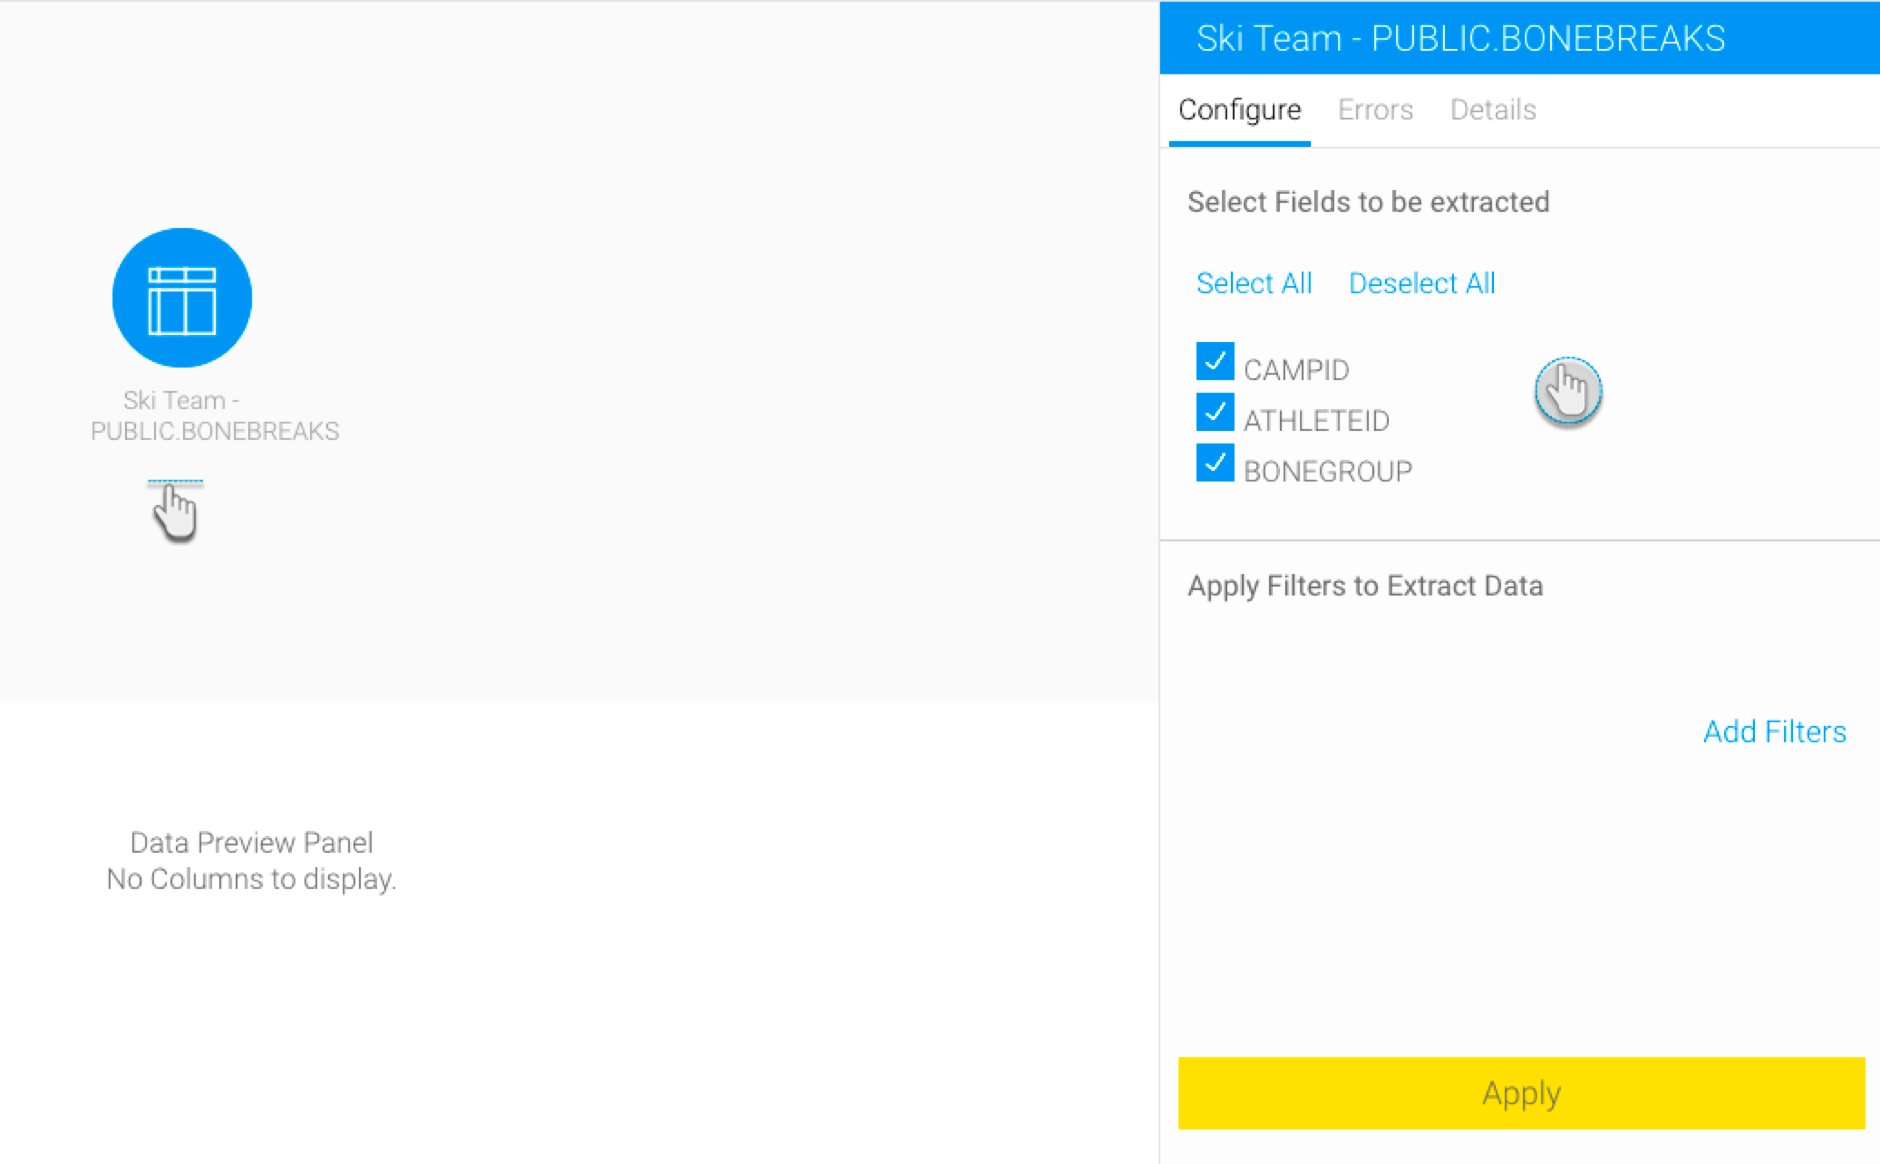
Select only the fields that you want data to be extracted from. (You can unselect any unwanted fields.)
Click on the Add Filter button to apply filters to control the data being extracted through the Filter popup.
Once you’re done with the configuration, click on the Apply button.
On doing so, the data preview panel will display the data extracted from the configured data source.

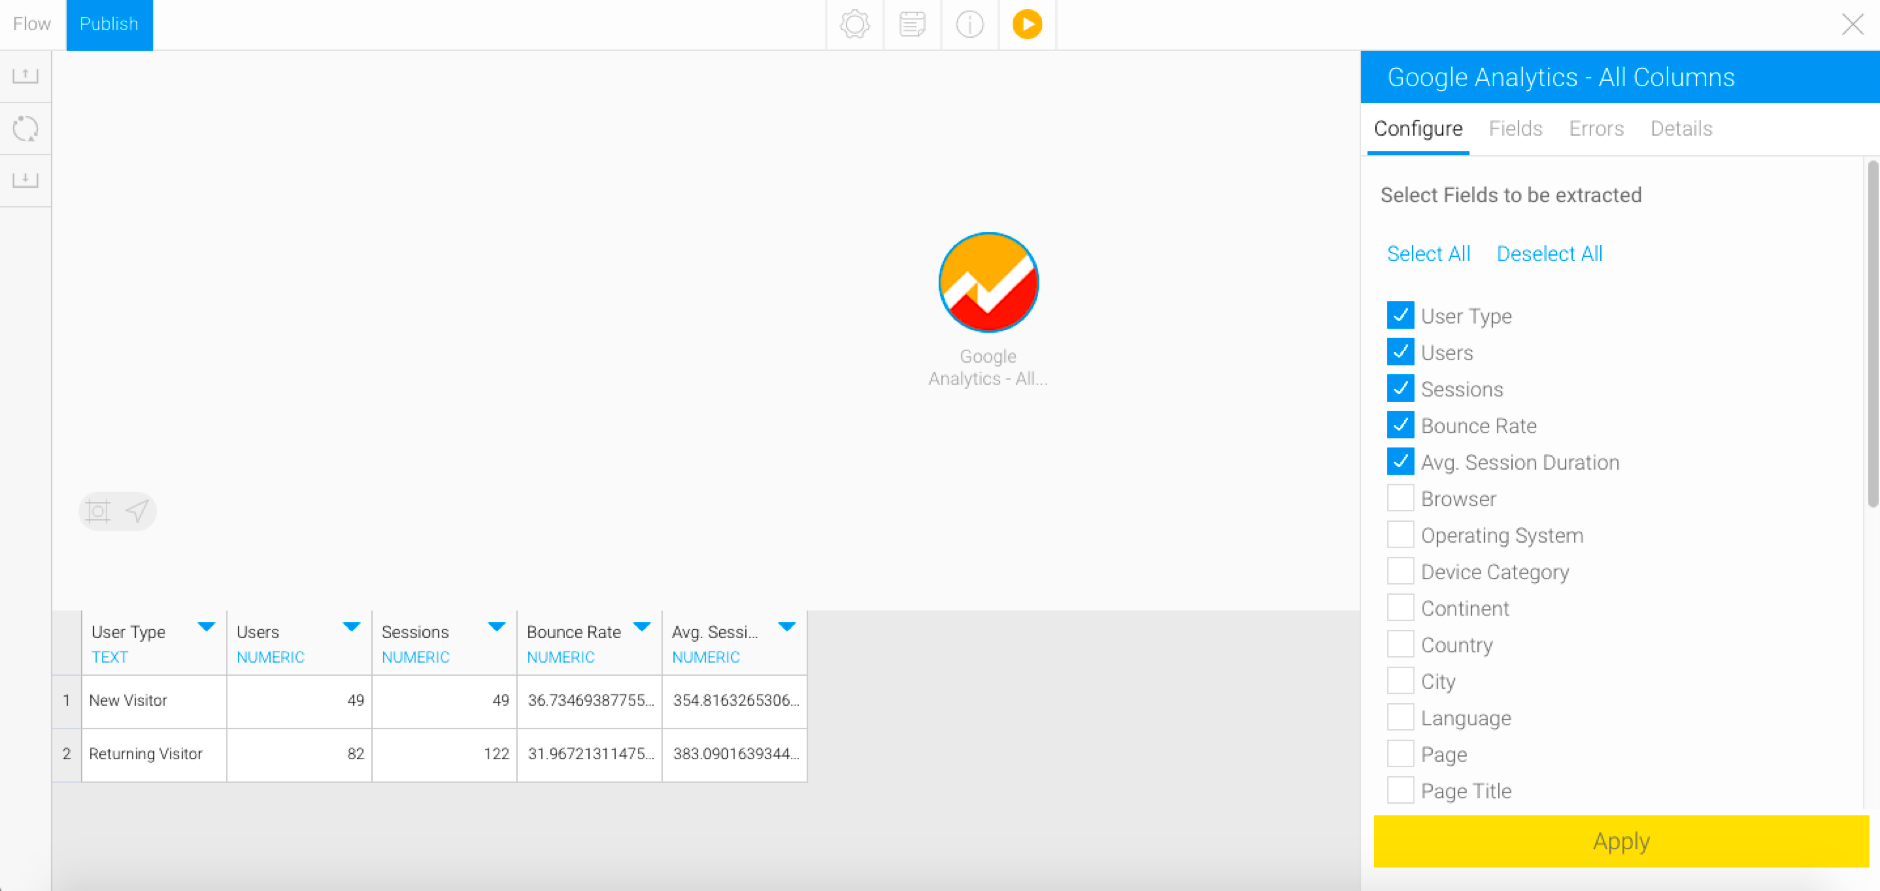
Third-party Connectors
- Drag the Third-party Table Connector option from the input step onto the canvas.
- A list of all third-party data sources will appear. (Ensure you have already created a third-party data source.)
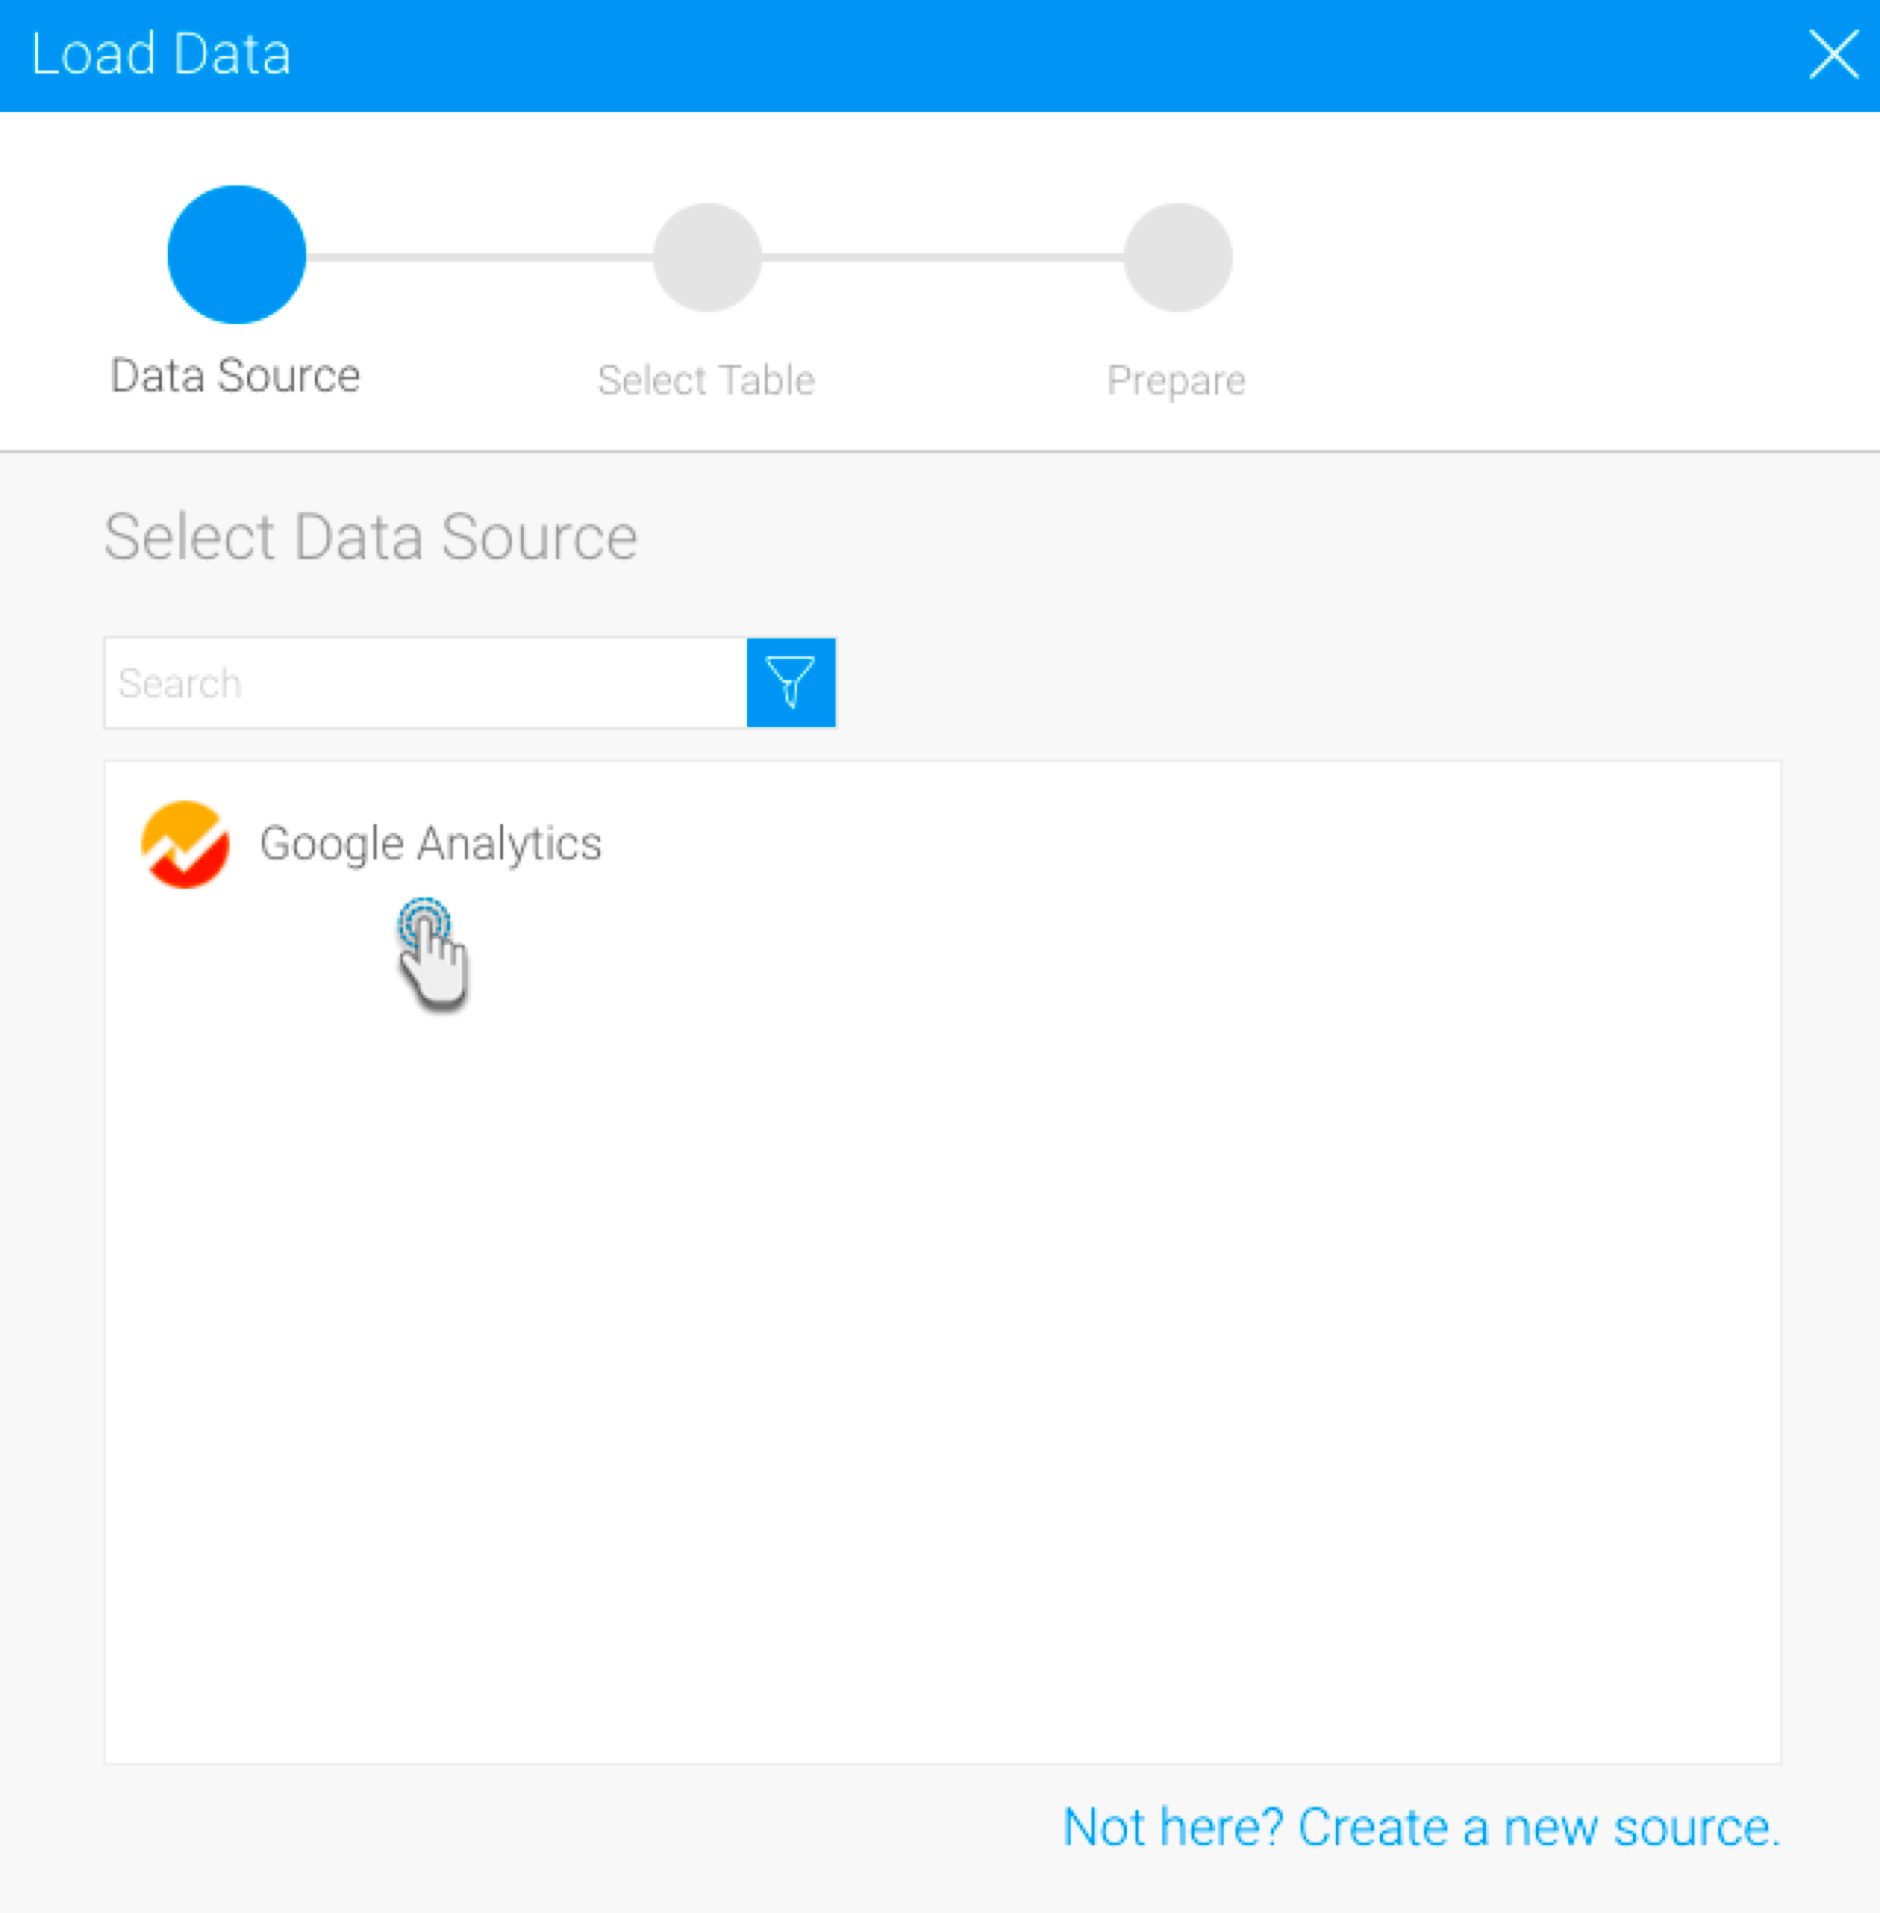
- Choose the data source that you want to use.
- Then select a table from the chosen data source.
- Finally, click Submit.

- Next choose the fields that are to be extracted.
- Note: If you’re extracting data from a Google Analytics table, you will need to provide the start and end dates to filter your data.
- Click on the Apply button. The extracted data will appear in the data preview panel.