Overview
The Data Transformation module supports different ways of extracting data from sources and loading it into Yellowfin, using the input steps. This section will show you how to use and configure each of these steps.

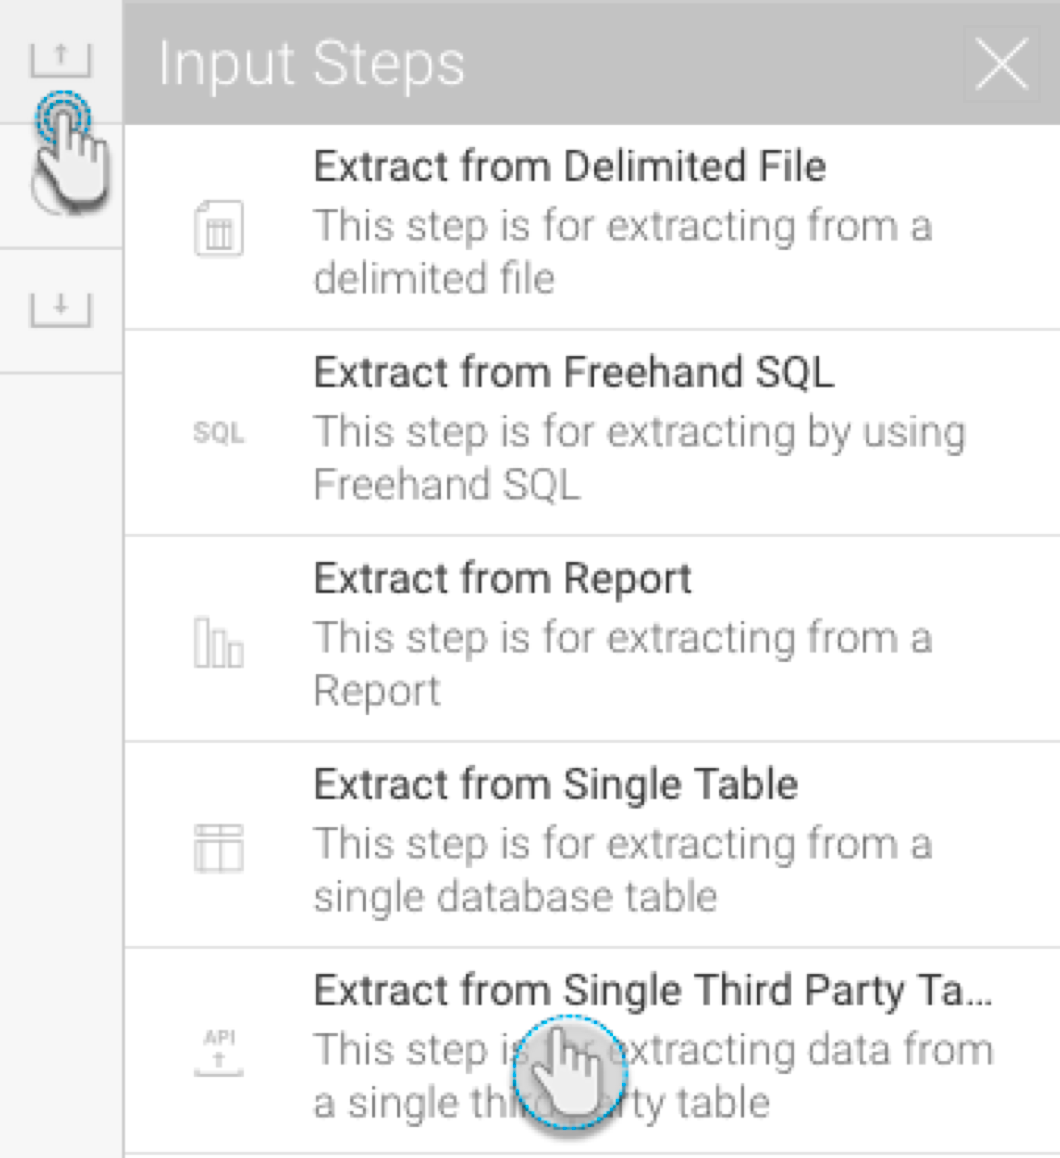
Icon | Input source | Description |
This input method is used when extracting data from a delimited file (that is, a file with separators). | ||
Use this method to import data from a database using an SQL query. | ||
Use this method to use a Yellowfin report as the source of data. This method accepts 2-dimensional reports, but not multi-dimensional ones. The following types of reports are currently not supported: Jasper, SSRS, and BIRT. | ||
This input step can be used to import data from a single database table. | ||
To extract data from a third-party connector. The connectors currently supported are: Google Analytics, Google Sheets, and Salesforce. |
Configuring Input Steps
Delimited File
- Drag the Delimited File option from the input step list.

Configure the step to extract data from the file. First select the file protocol.
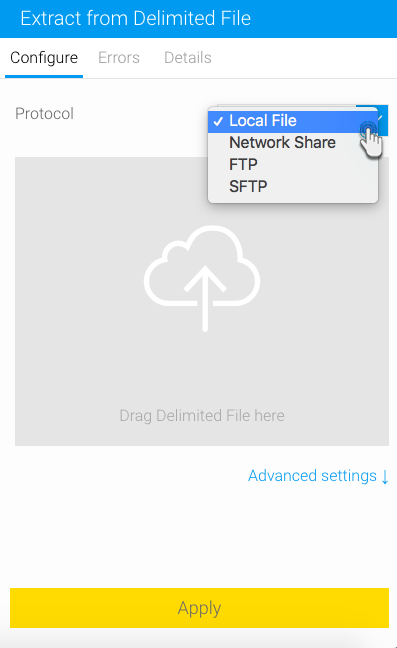
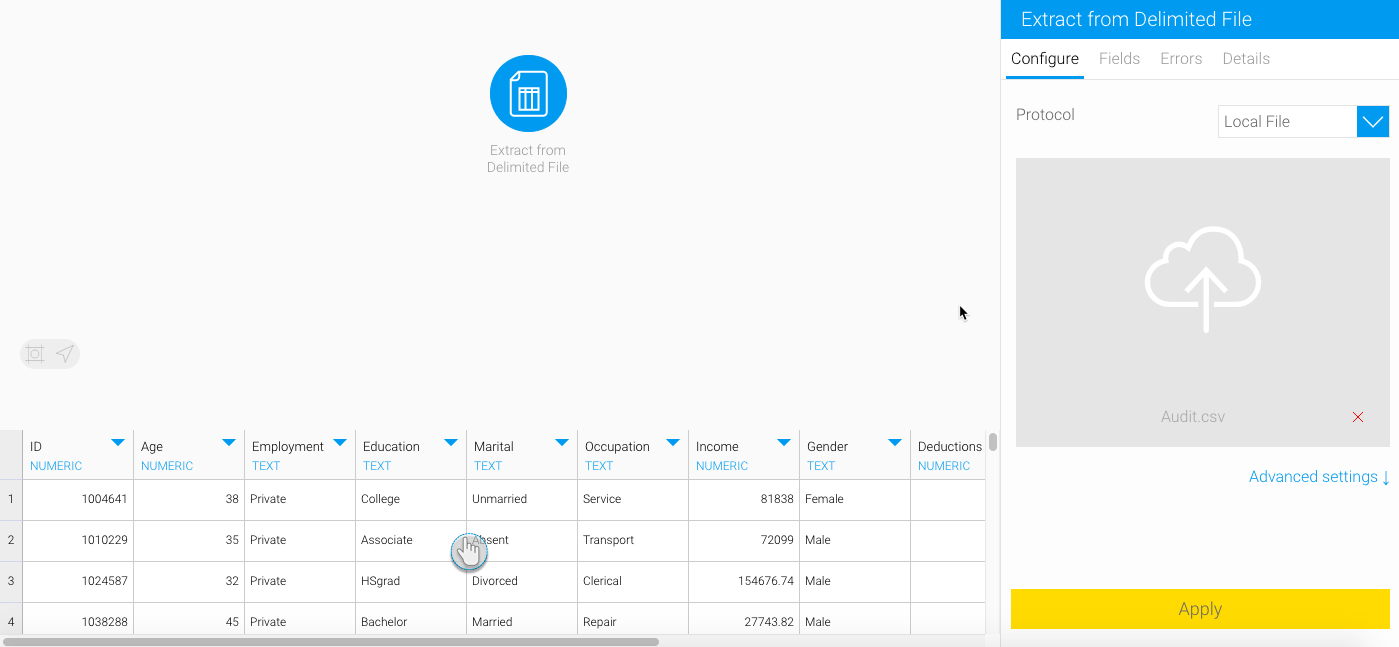
If the file to be imported is available locally, choose the Local option and drag it into the specified area (or click on it to browse and select the file).
If you have selected to import a local file, the file should be local on your server.
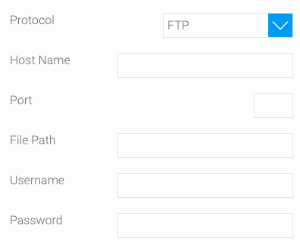
But to use a file that's available on a network, select the correct protocol (Network Share, FTP, or SFTP), then provide connection details to connect to the network.
You can also provide additional configuration settings by enabling the Advanced Settings toggle.

- First row contains unique titles: Enable this toggle switch if the first row of the file contains titles or column names. If switched on, the system will read these values as the column field titles.
- Field separator: Choose a character from the list to use it to separate values in the CSV, or enter a custom one after selecting the Other option.
- Decimal separator: Choose a character from the list to set it as the decimal separator, or enter a custom one after selecting the Other option.
- File encoding: Select a file encoding option.
- Precision: Use this to specify how many rows of the CVS file Yellowfin will examine in order to define the field types and size.
- Low Precision is fast, and only examines the first 1000 rows of the file.
- High Precision is slower, depending on the size of the file, as it examines all rows.
Finally, click Apply. Data extracted from the file will appear in the data preview panel.
Freehand SQL
- Drag the Freehand SQL option.

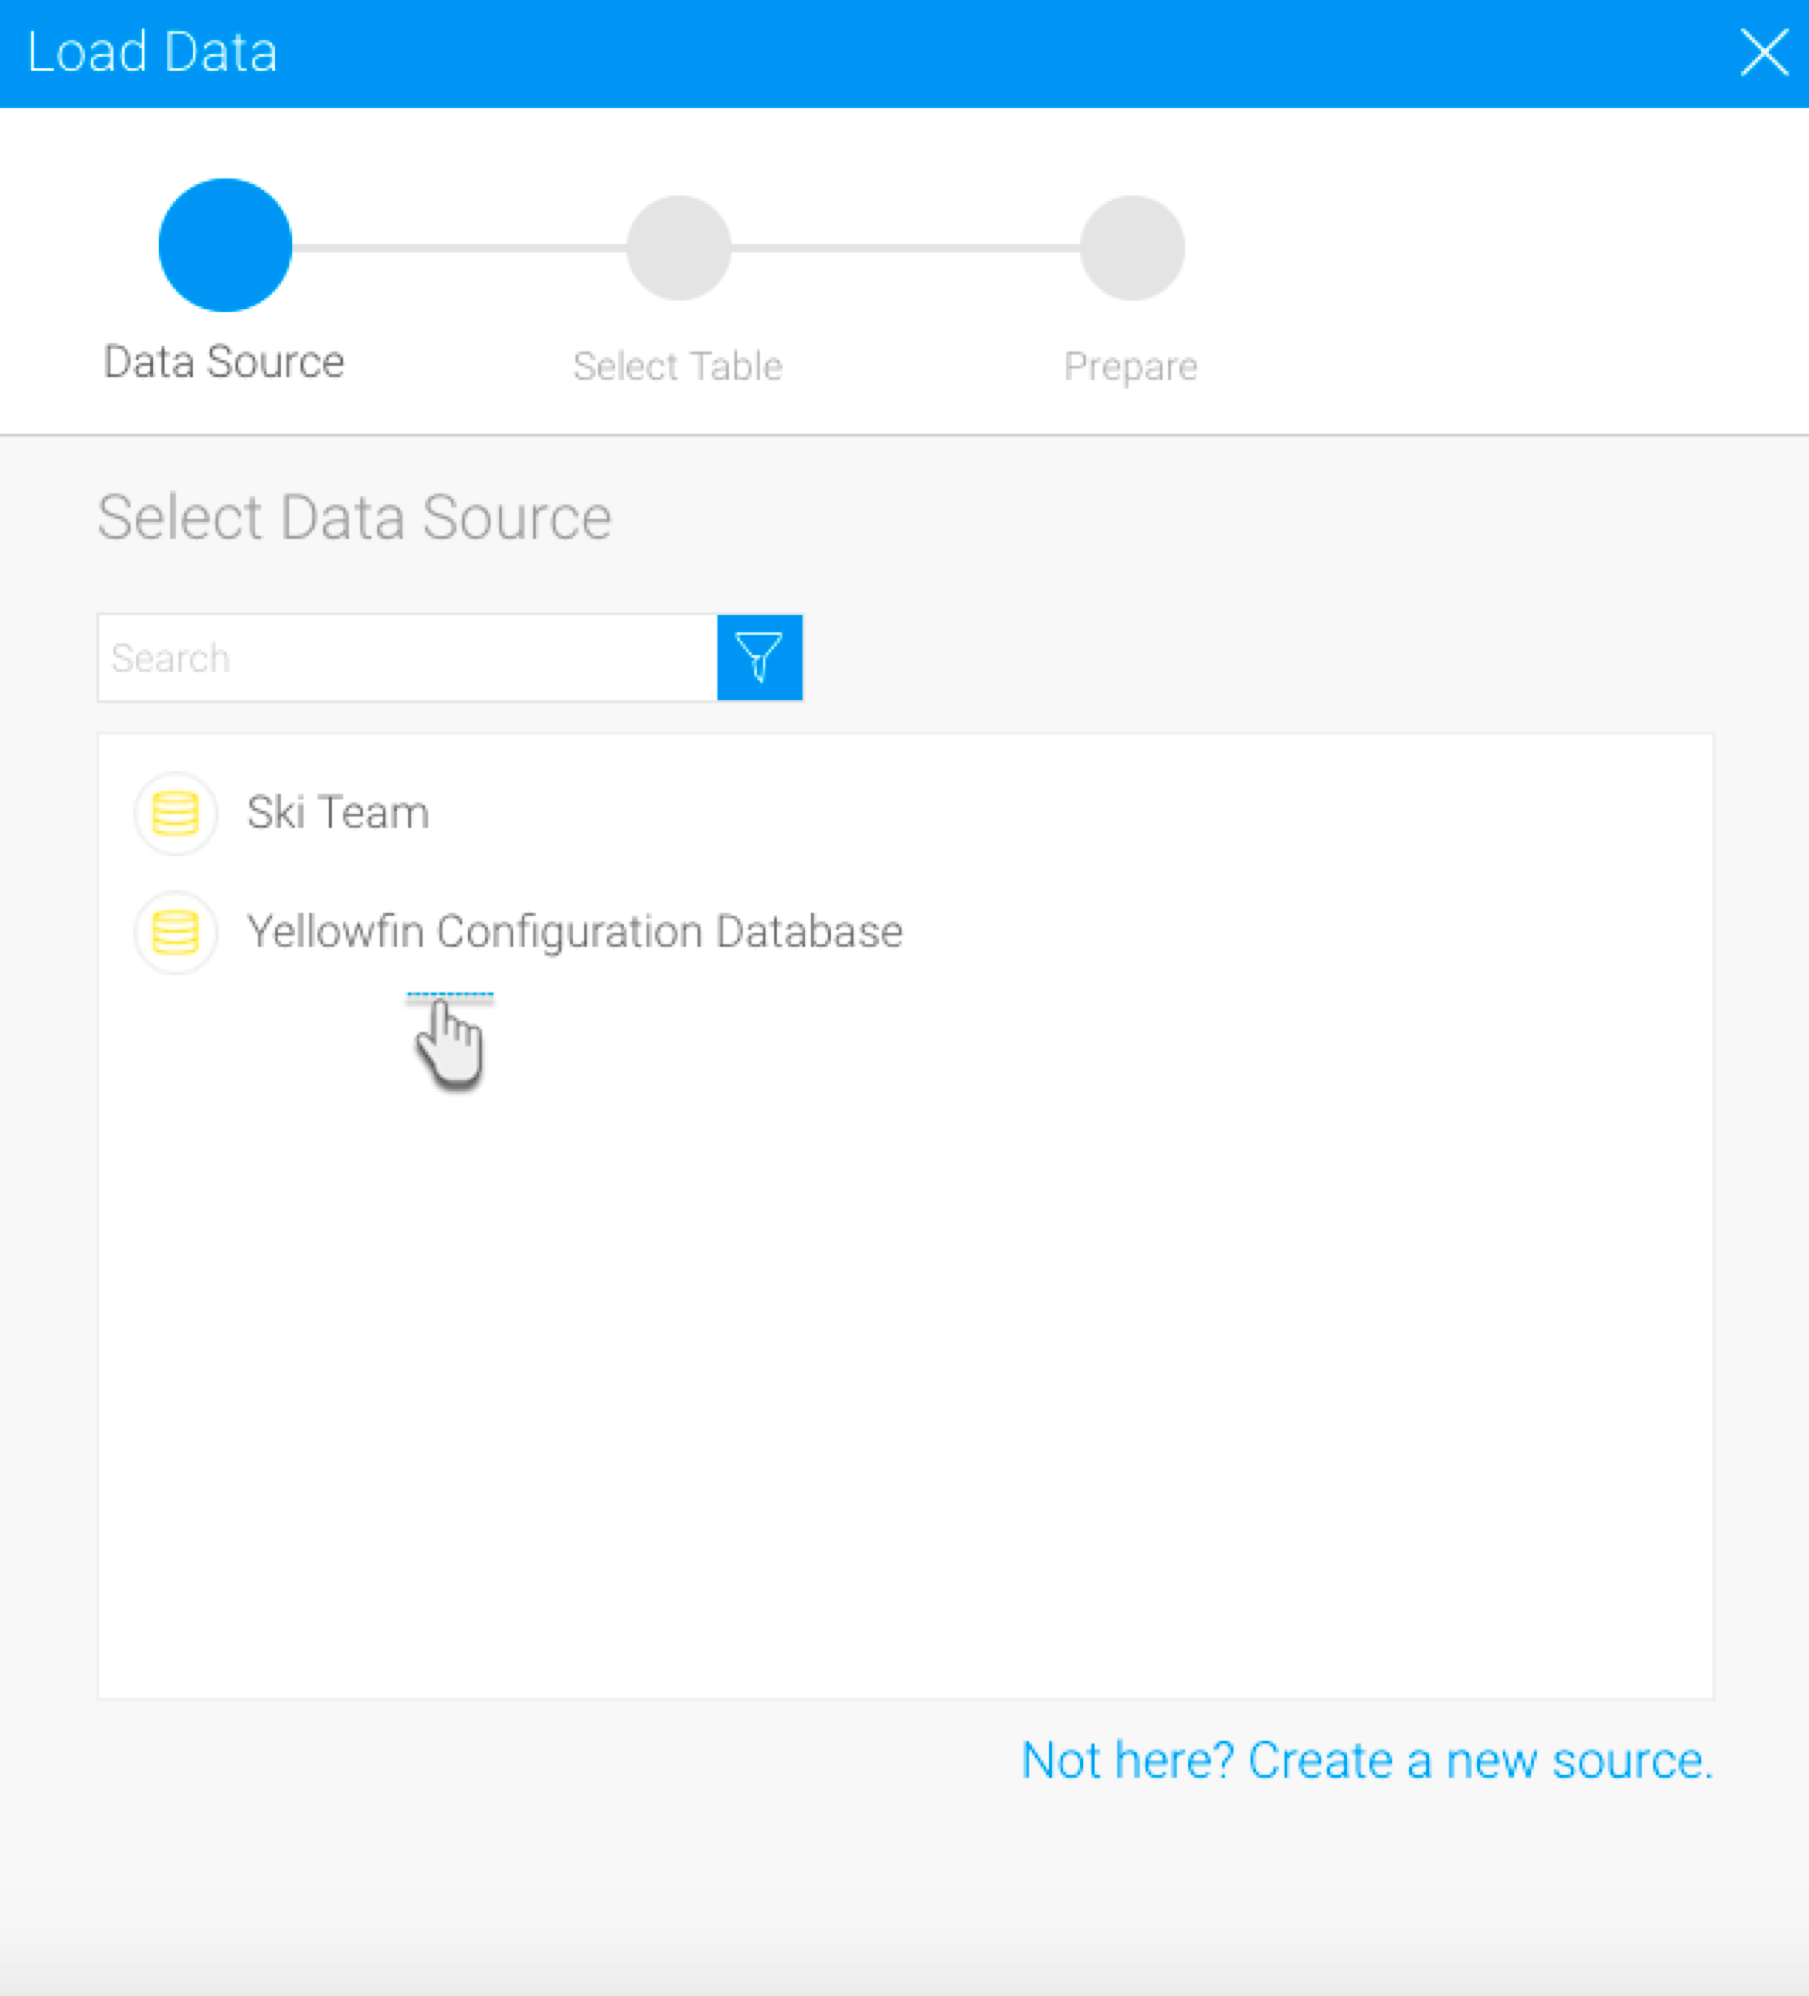
- Select the data source that you want to use.
- Write a SQL query to extract the required data.
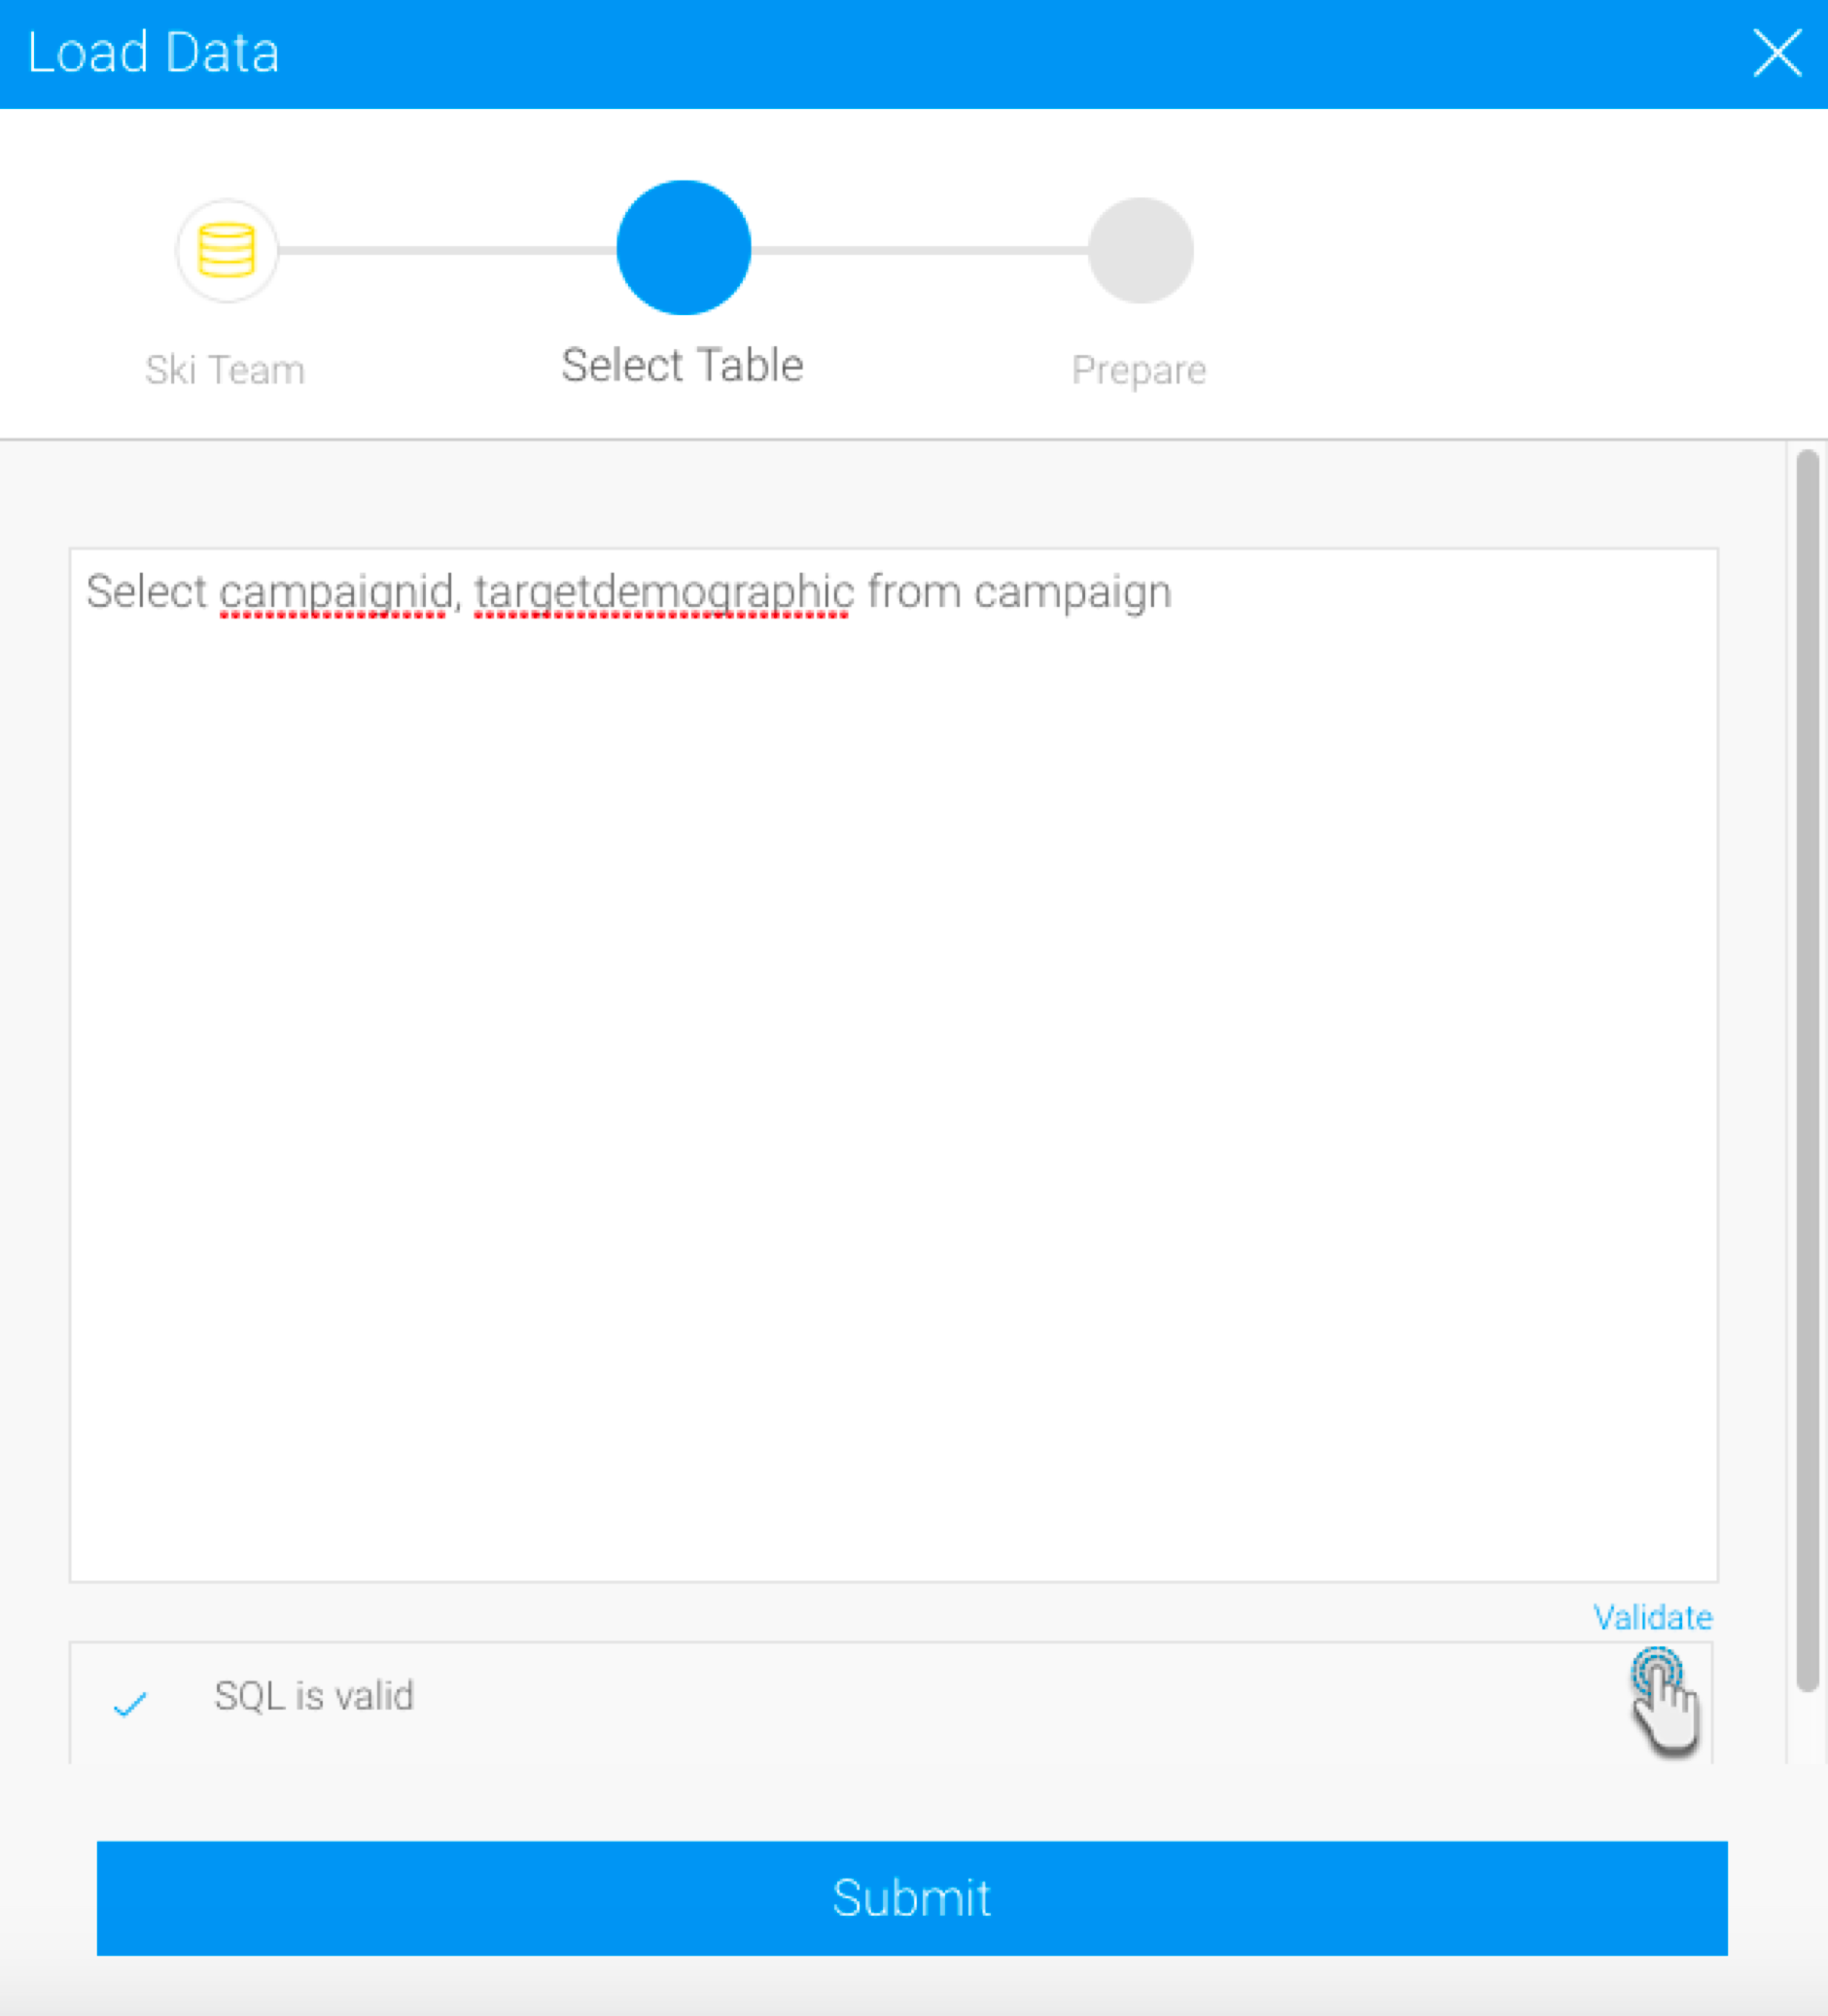
- You can click on the Validate option to check the validity of the SQL you provided. This ensures there are no errors in the query.
- Click on the Submit button when you are sure your query is correct.
- Then click on Apply in the Configure panel. The extracted data will appear in the data preview panel.
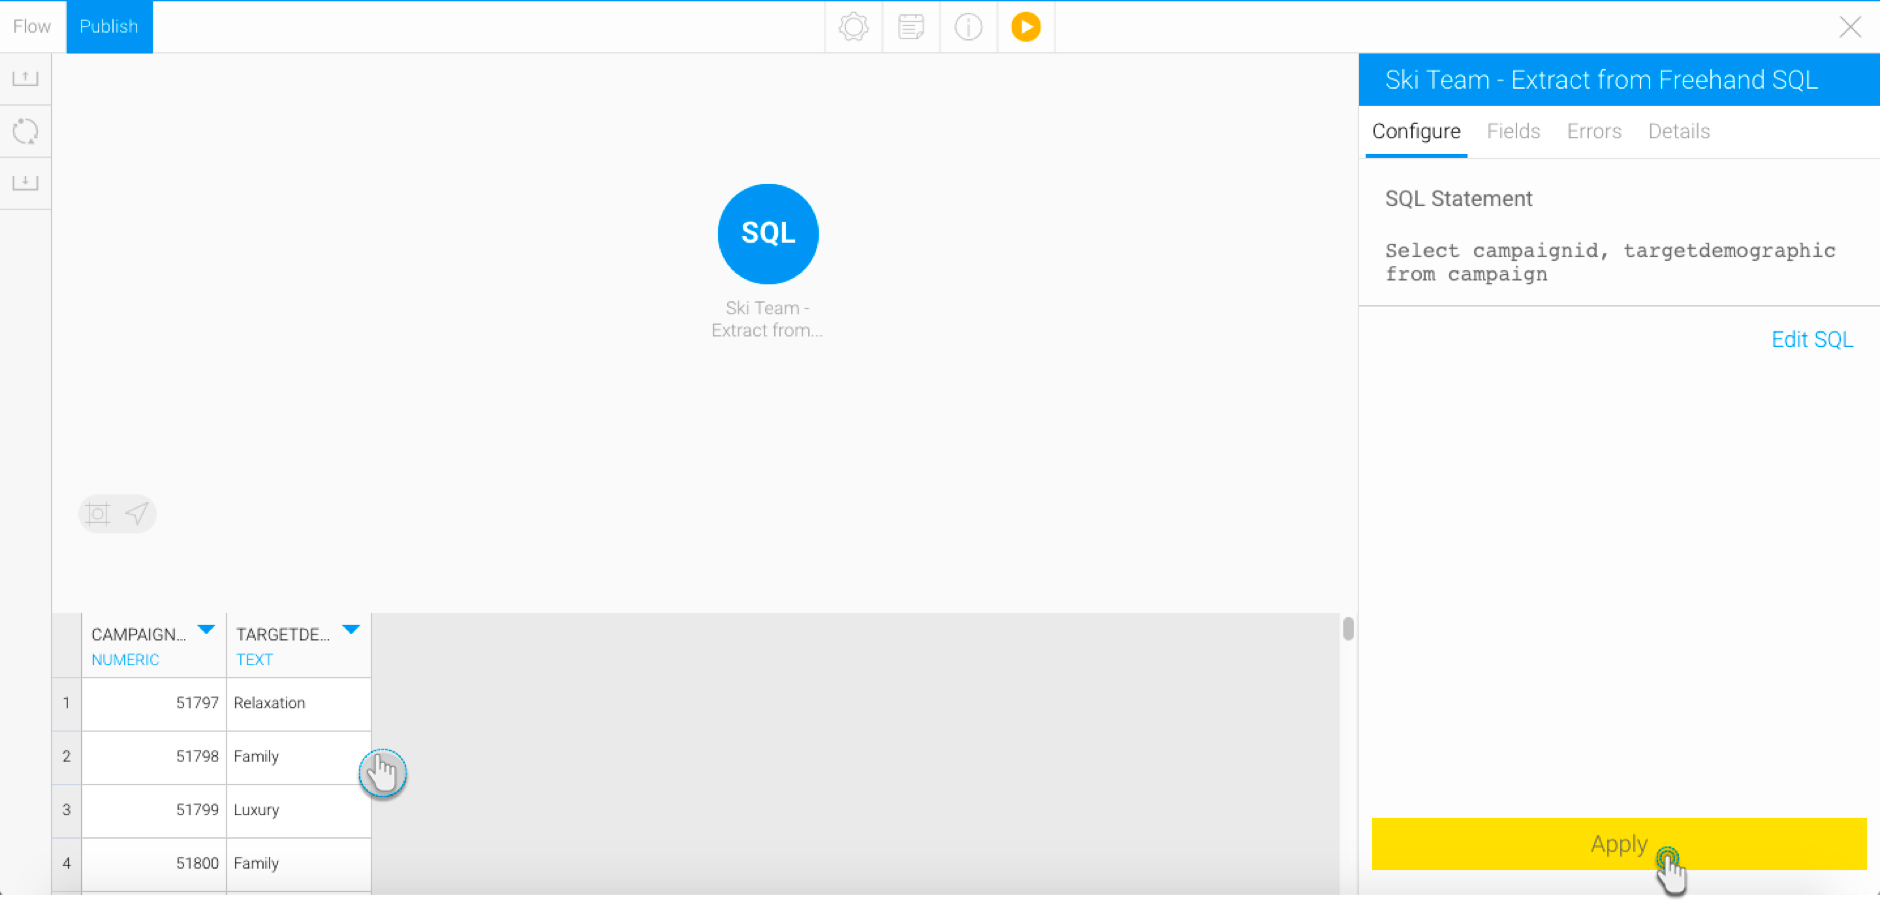
- To change the freehand SQL query, click the Edit SQL option in the Configure panel.
Report
- Extend the input steps panel and drag the Report input step onto the transformation canvas.

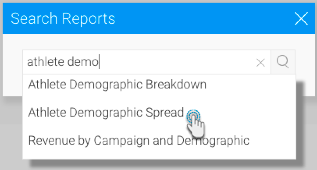
- Search for the report that you want to extract data from, by entering and then clicking on its name.
- Once a report is selected, its column field names will be displayed.
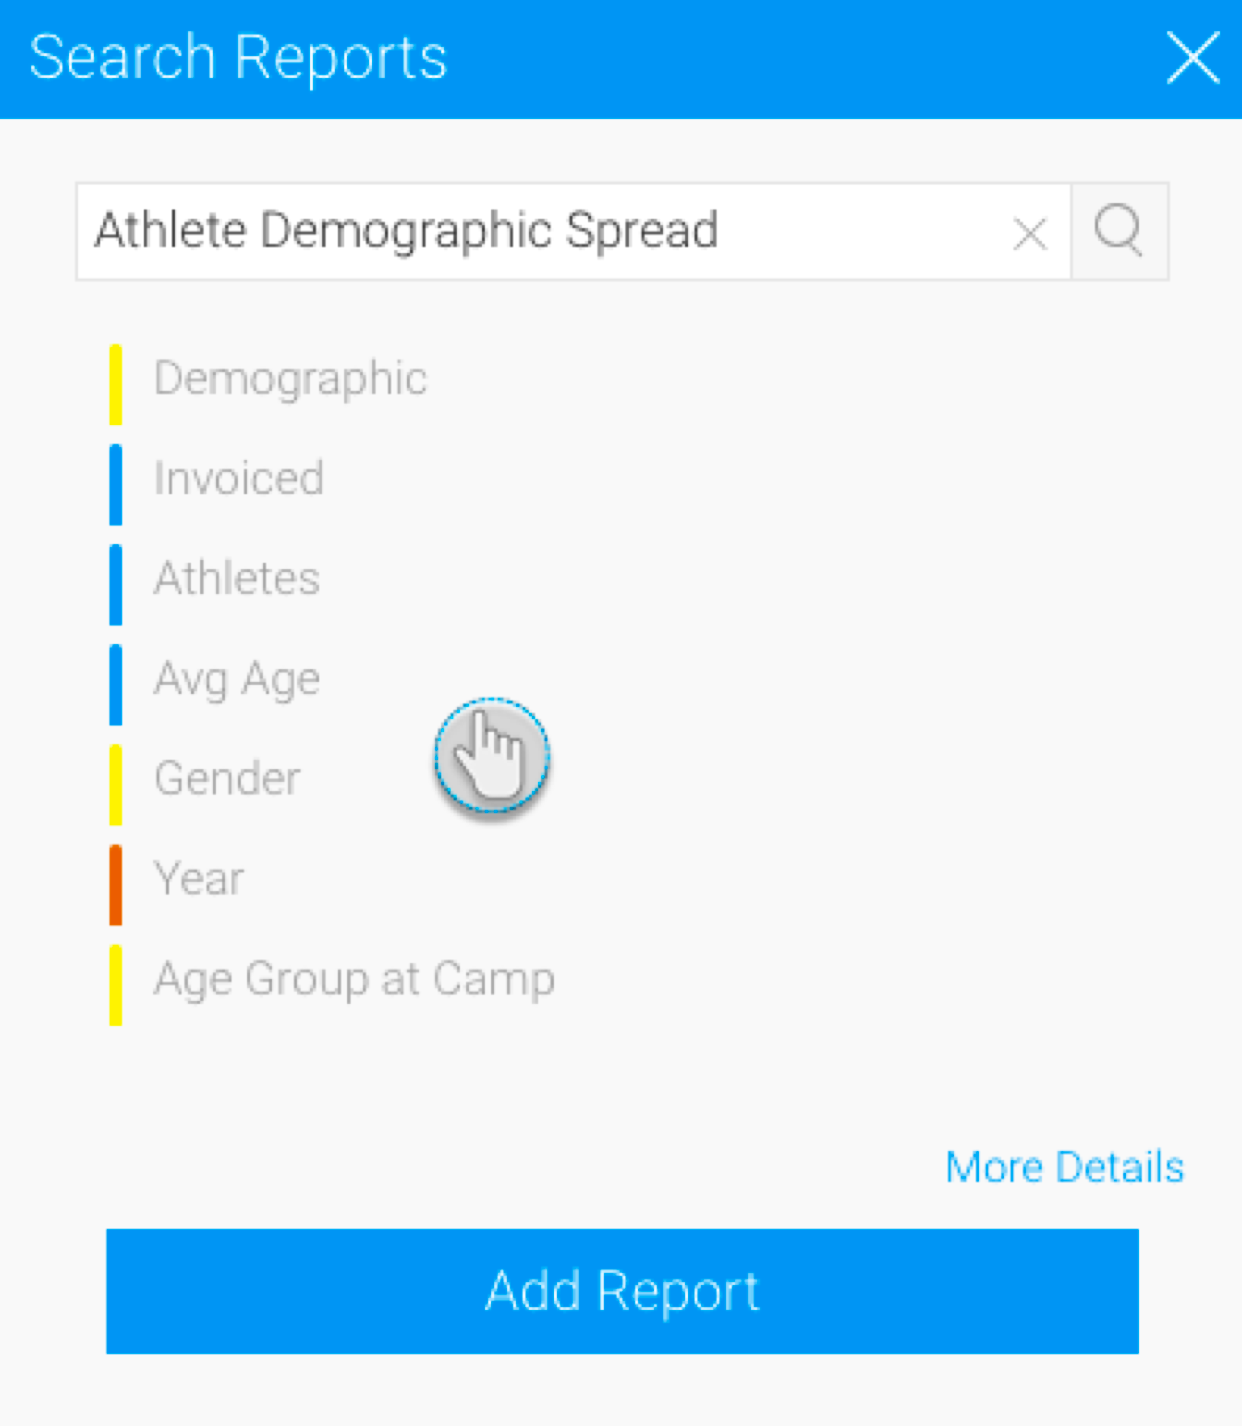
- Click on the Add Report button.
- The report fields can be customized in the Configure panel.
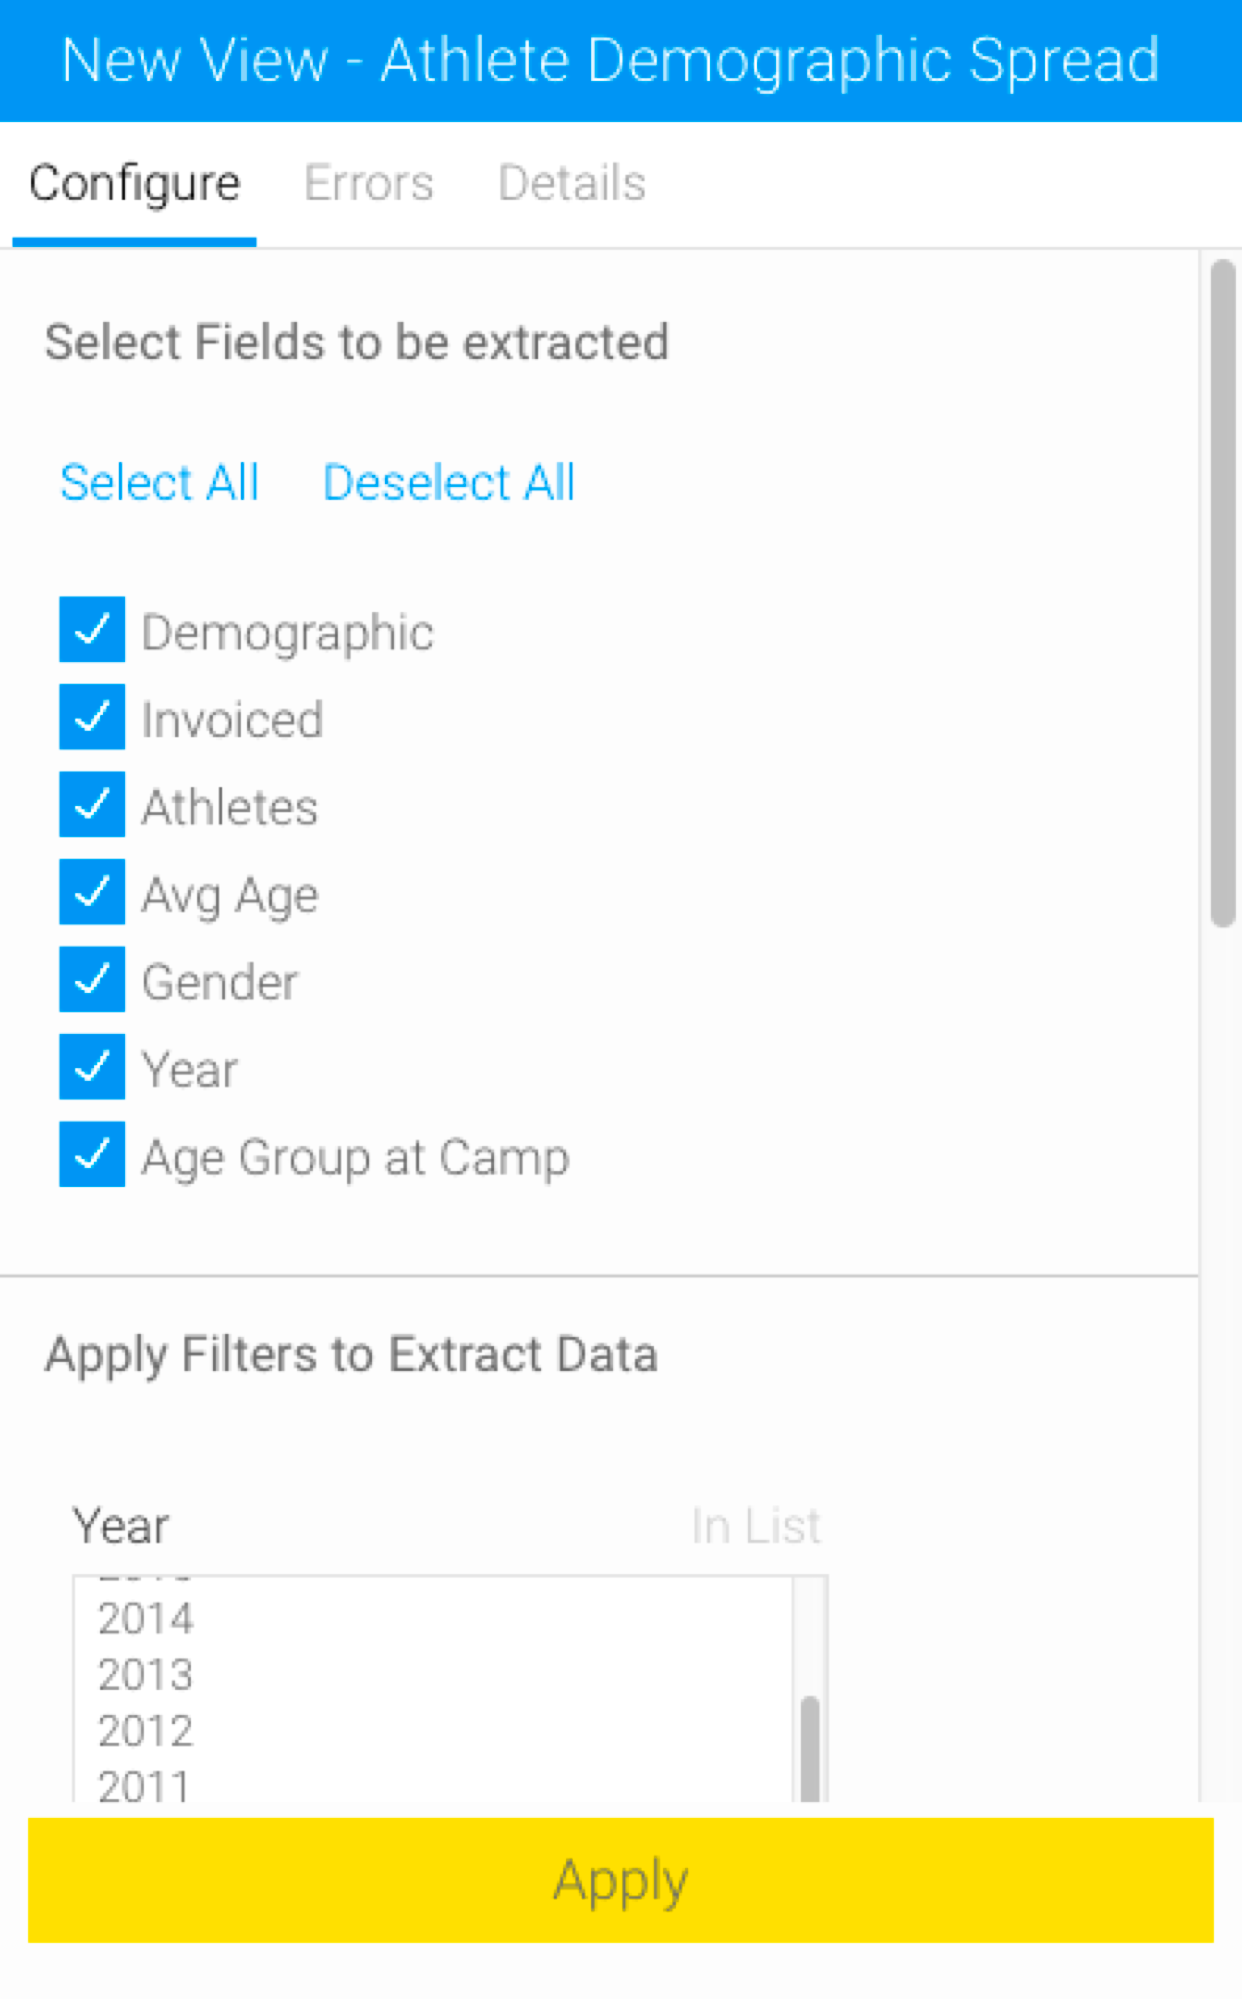
- You can remove fields that you don’t want included.
- If the report has any embedded user-prompt filters, they will also appear here. You can apply these filters when extracting data.
- Then click Apply. You can see the extracted data from the report in the data preview panel.
If a report that has already been configured into a transformation flow, gets changes made to it directly, then the report step will need to be manually configured again. To do this, simply click on the report input step, and when the transformation flow panel gets updated with the step’s configuration details, click Apply.
Editing a configured report
When a user tries to edit a report that is being used in a transformation flow, they will see the following warning:

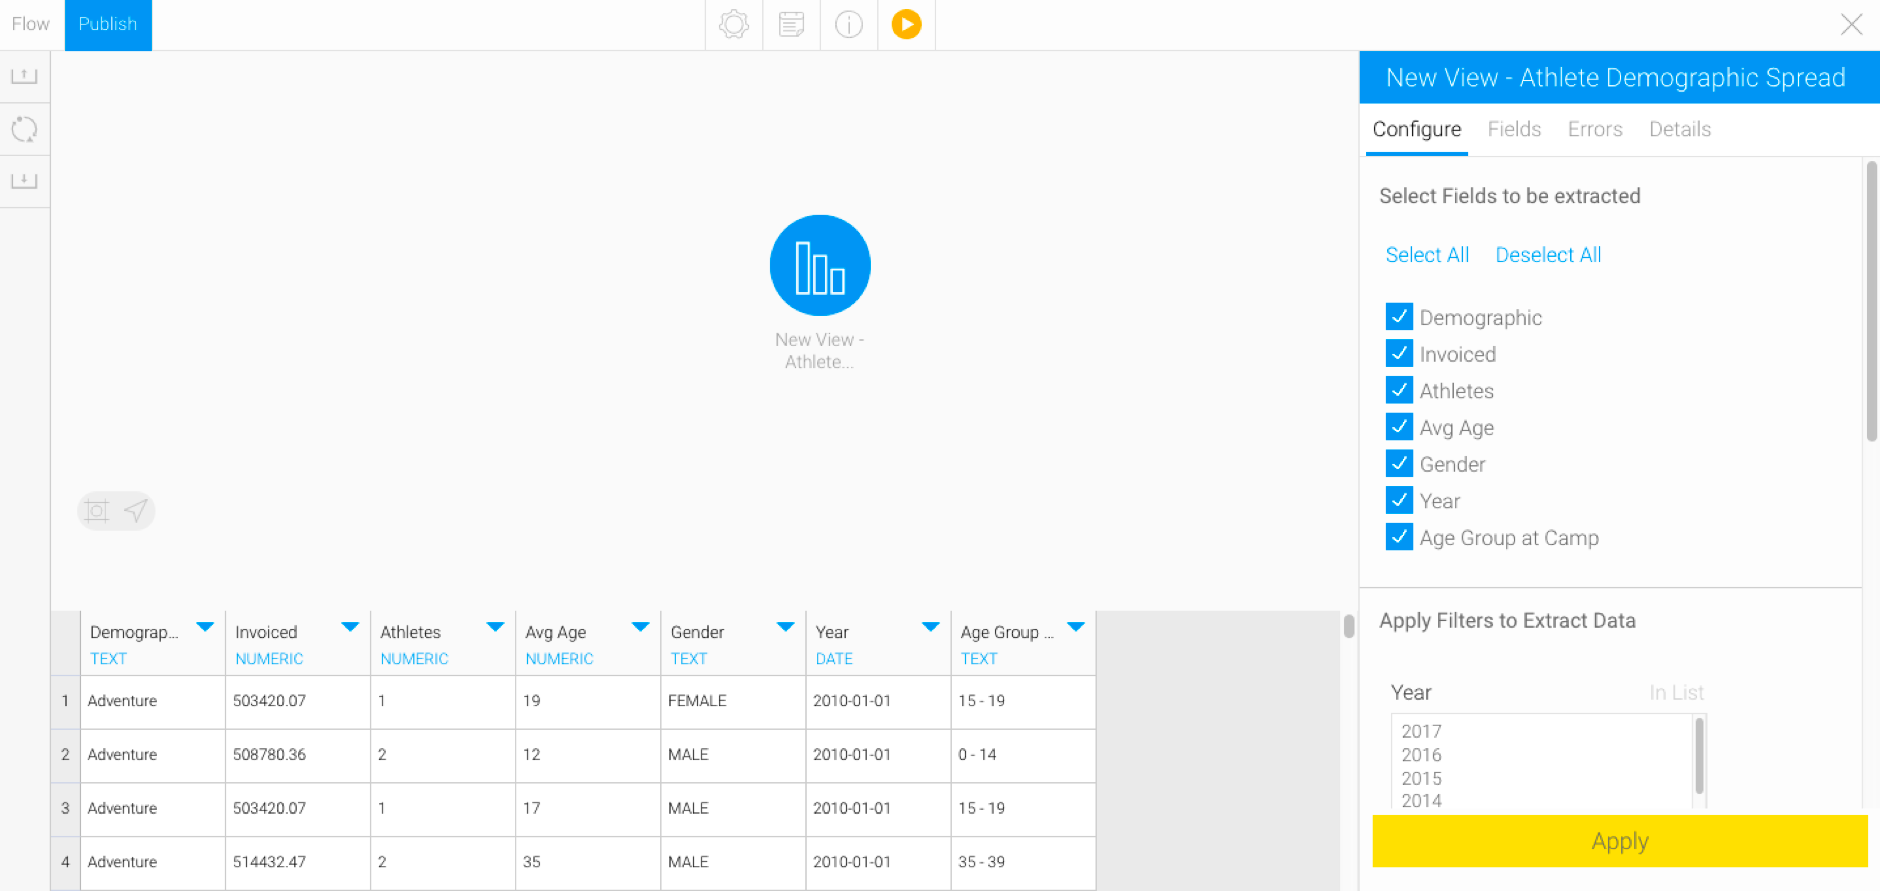
Once the report has been edited, the transformation flow will show an error on this step, indicating that changes has been made to the report that haven't been configured yet. For example:

Cases that require manual configuration
When a new field is added to the report.
When a field is removed from the report.
The datatype of a field gets changed. (From example, from Text to Numeric.)
If the report has user-prompted filters, and they are selected while configuring the step, but then these filters are changed or removed from the report. (However if the filters aren’t selected during configuration, then the step will continue to work without breaking.)
Note: If a configured report gets converted to a multi dimensional or section report, then the input step will fail to work. This cannot be fixed by using the Apply button, since such reports are not supported in the Data Transformation module.
Single Database Table
Drag the Single Table option onto the canvas.

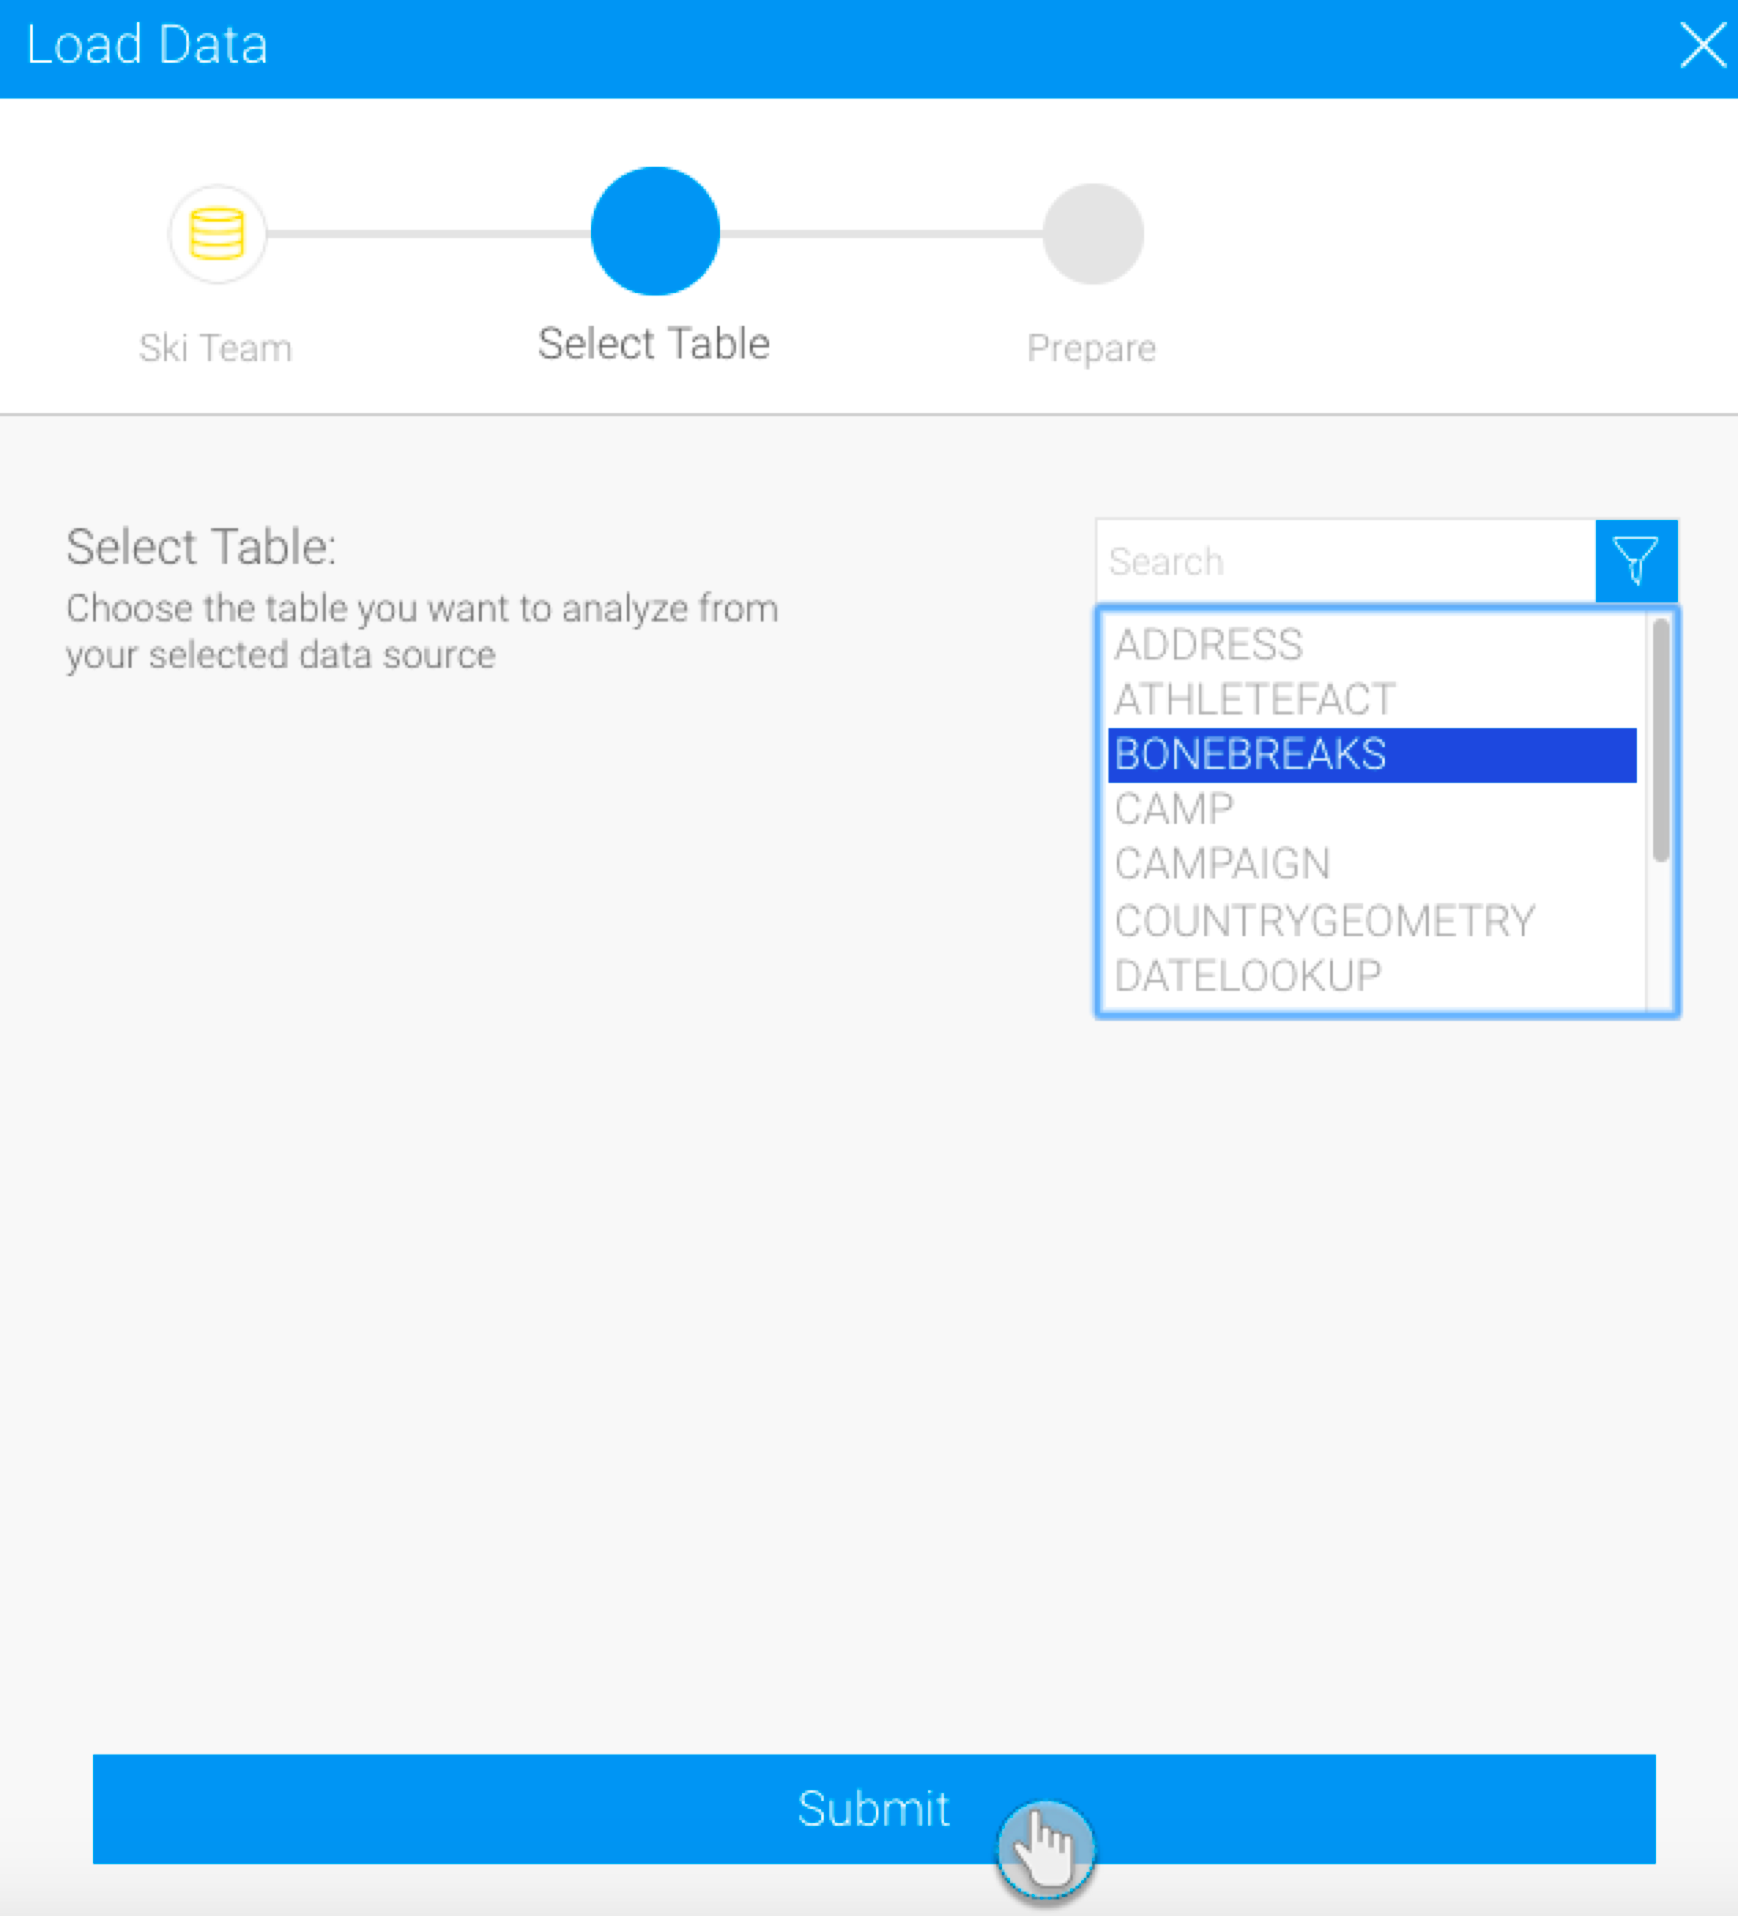
On the appearance of the popup, select the database you want to use.
Then choose a table. And click on the Submit button.
The details of this step can be configured through the configure panel.
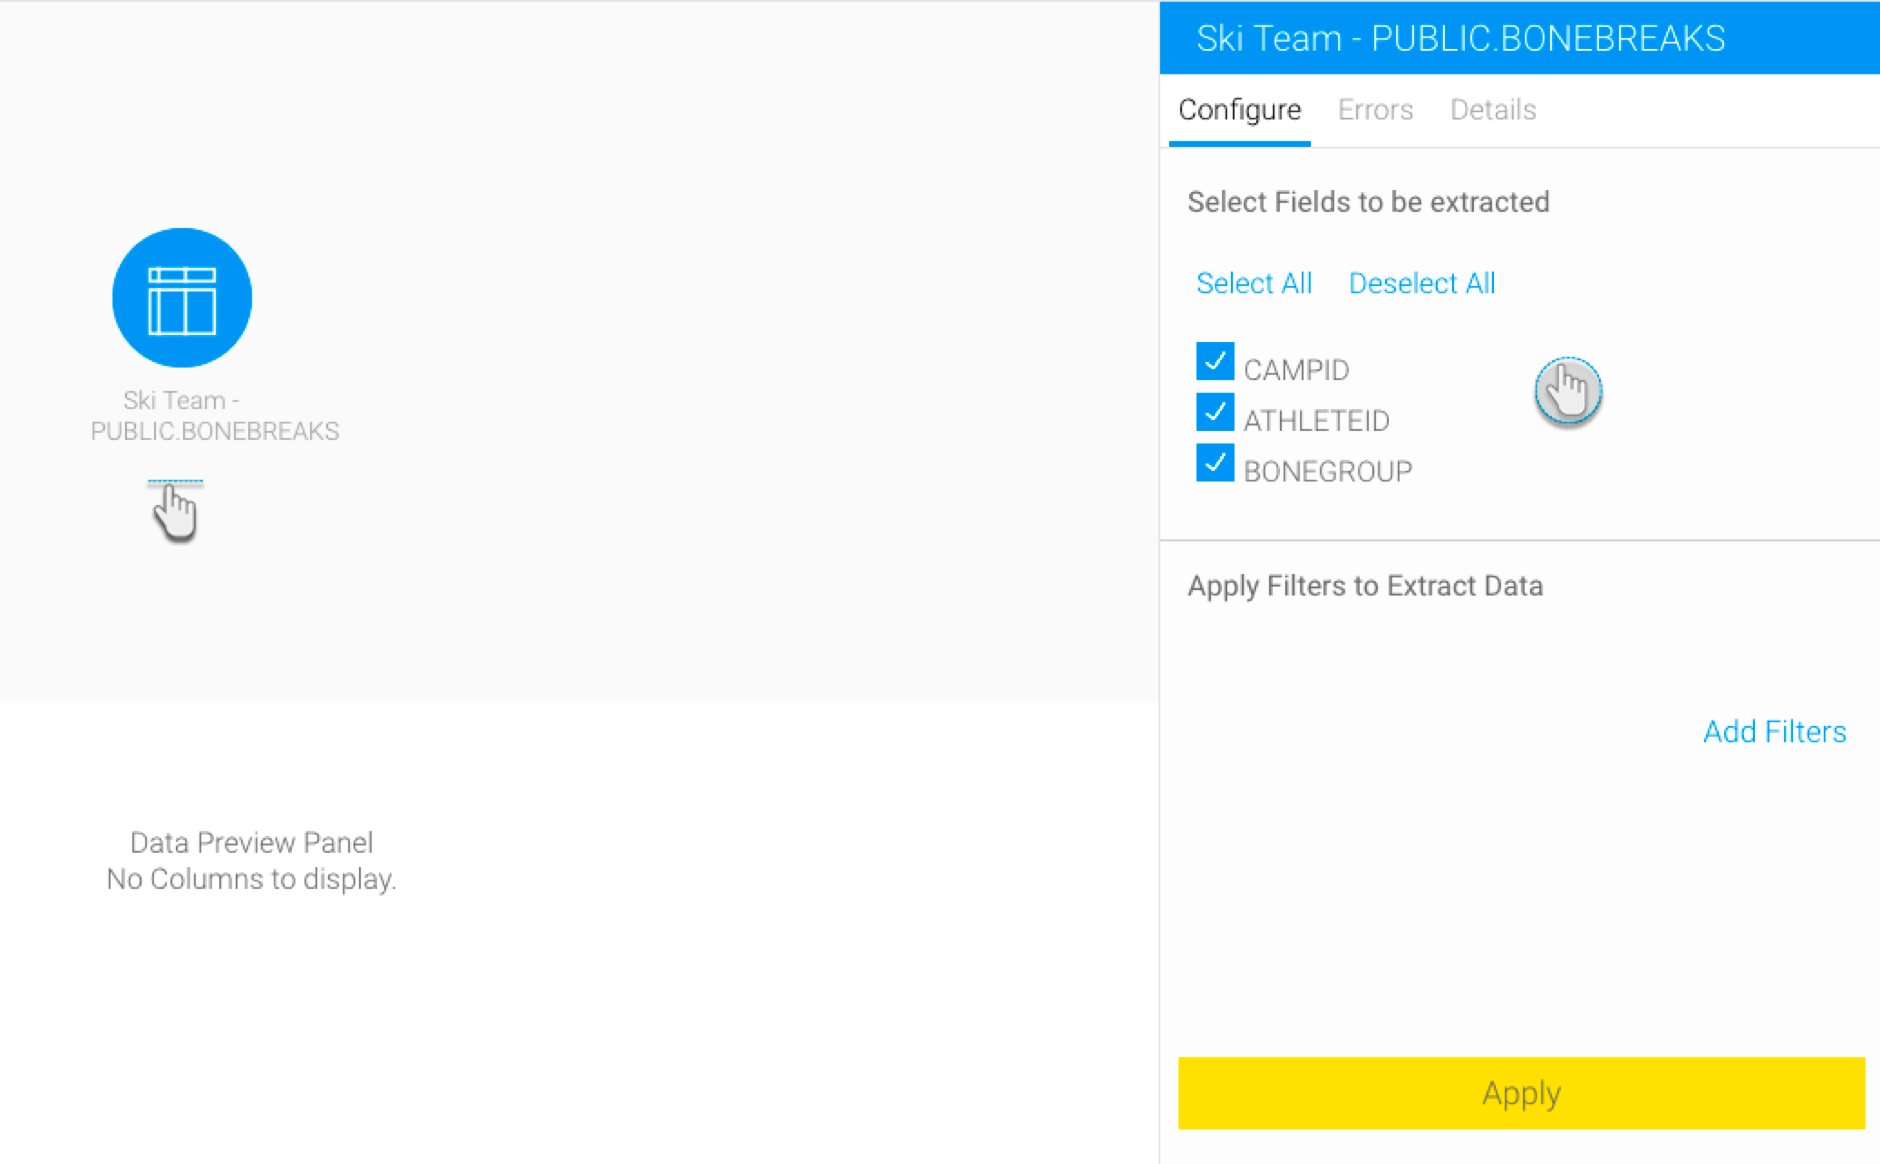
Select only the fields that you want data to be extracted from. (You can unselect any unwanted fields.)
Click on the Add Filter button to apply filters to control the data being extracted through the Filter popup.
Once you’re done with the configuration, click on the Apply button.
On doing so, the data preview panel will display the data extracted from the configured data source.

Third-party Connectors
- Drag the Third-party Table Connector option from the input step onto the canvas.
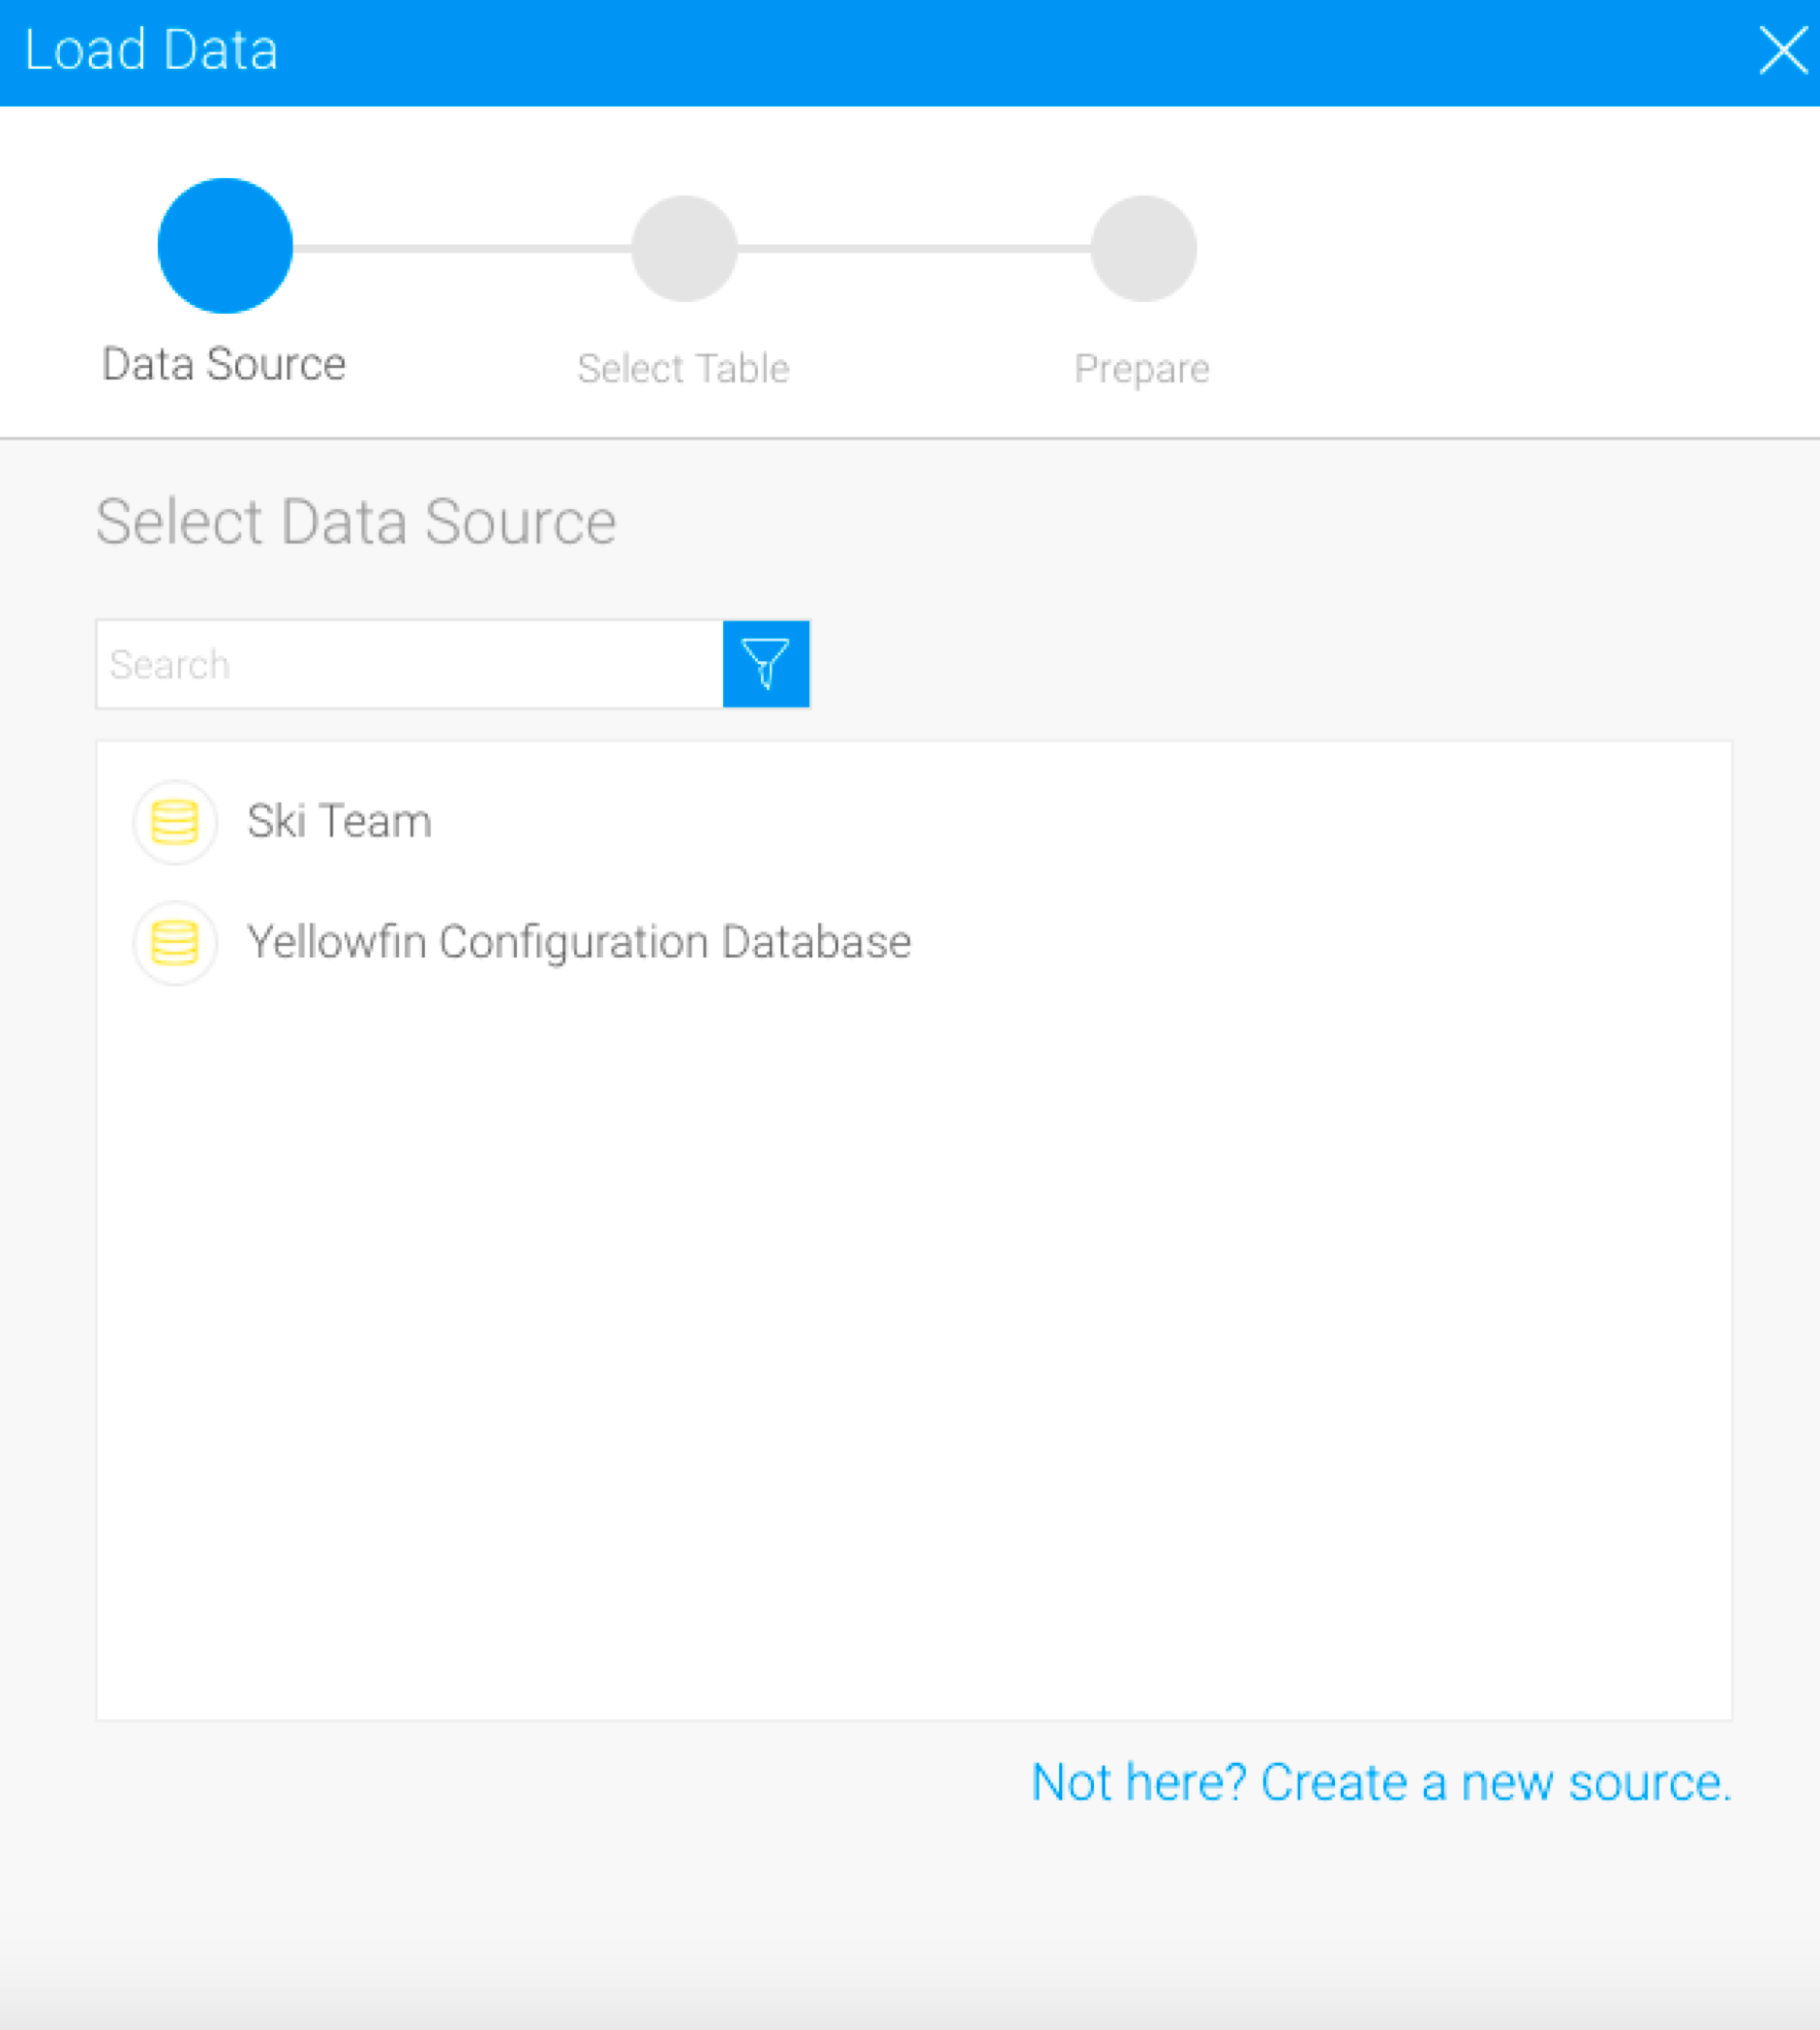
- A list of all third-party data sources will appear. (You can also click on the Not here? link at the bottom to create a new third-party source.)
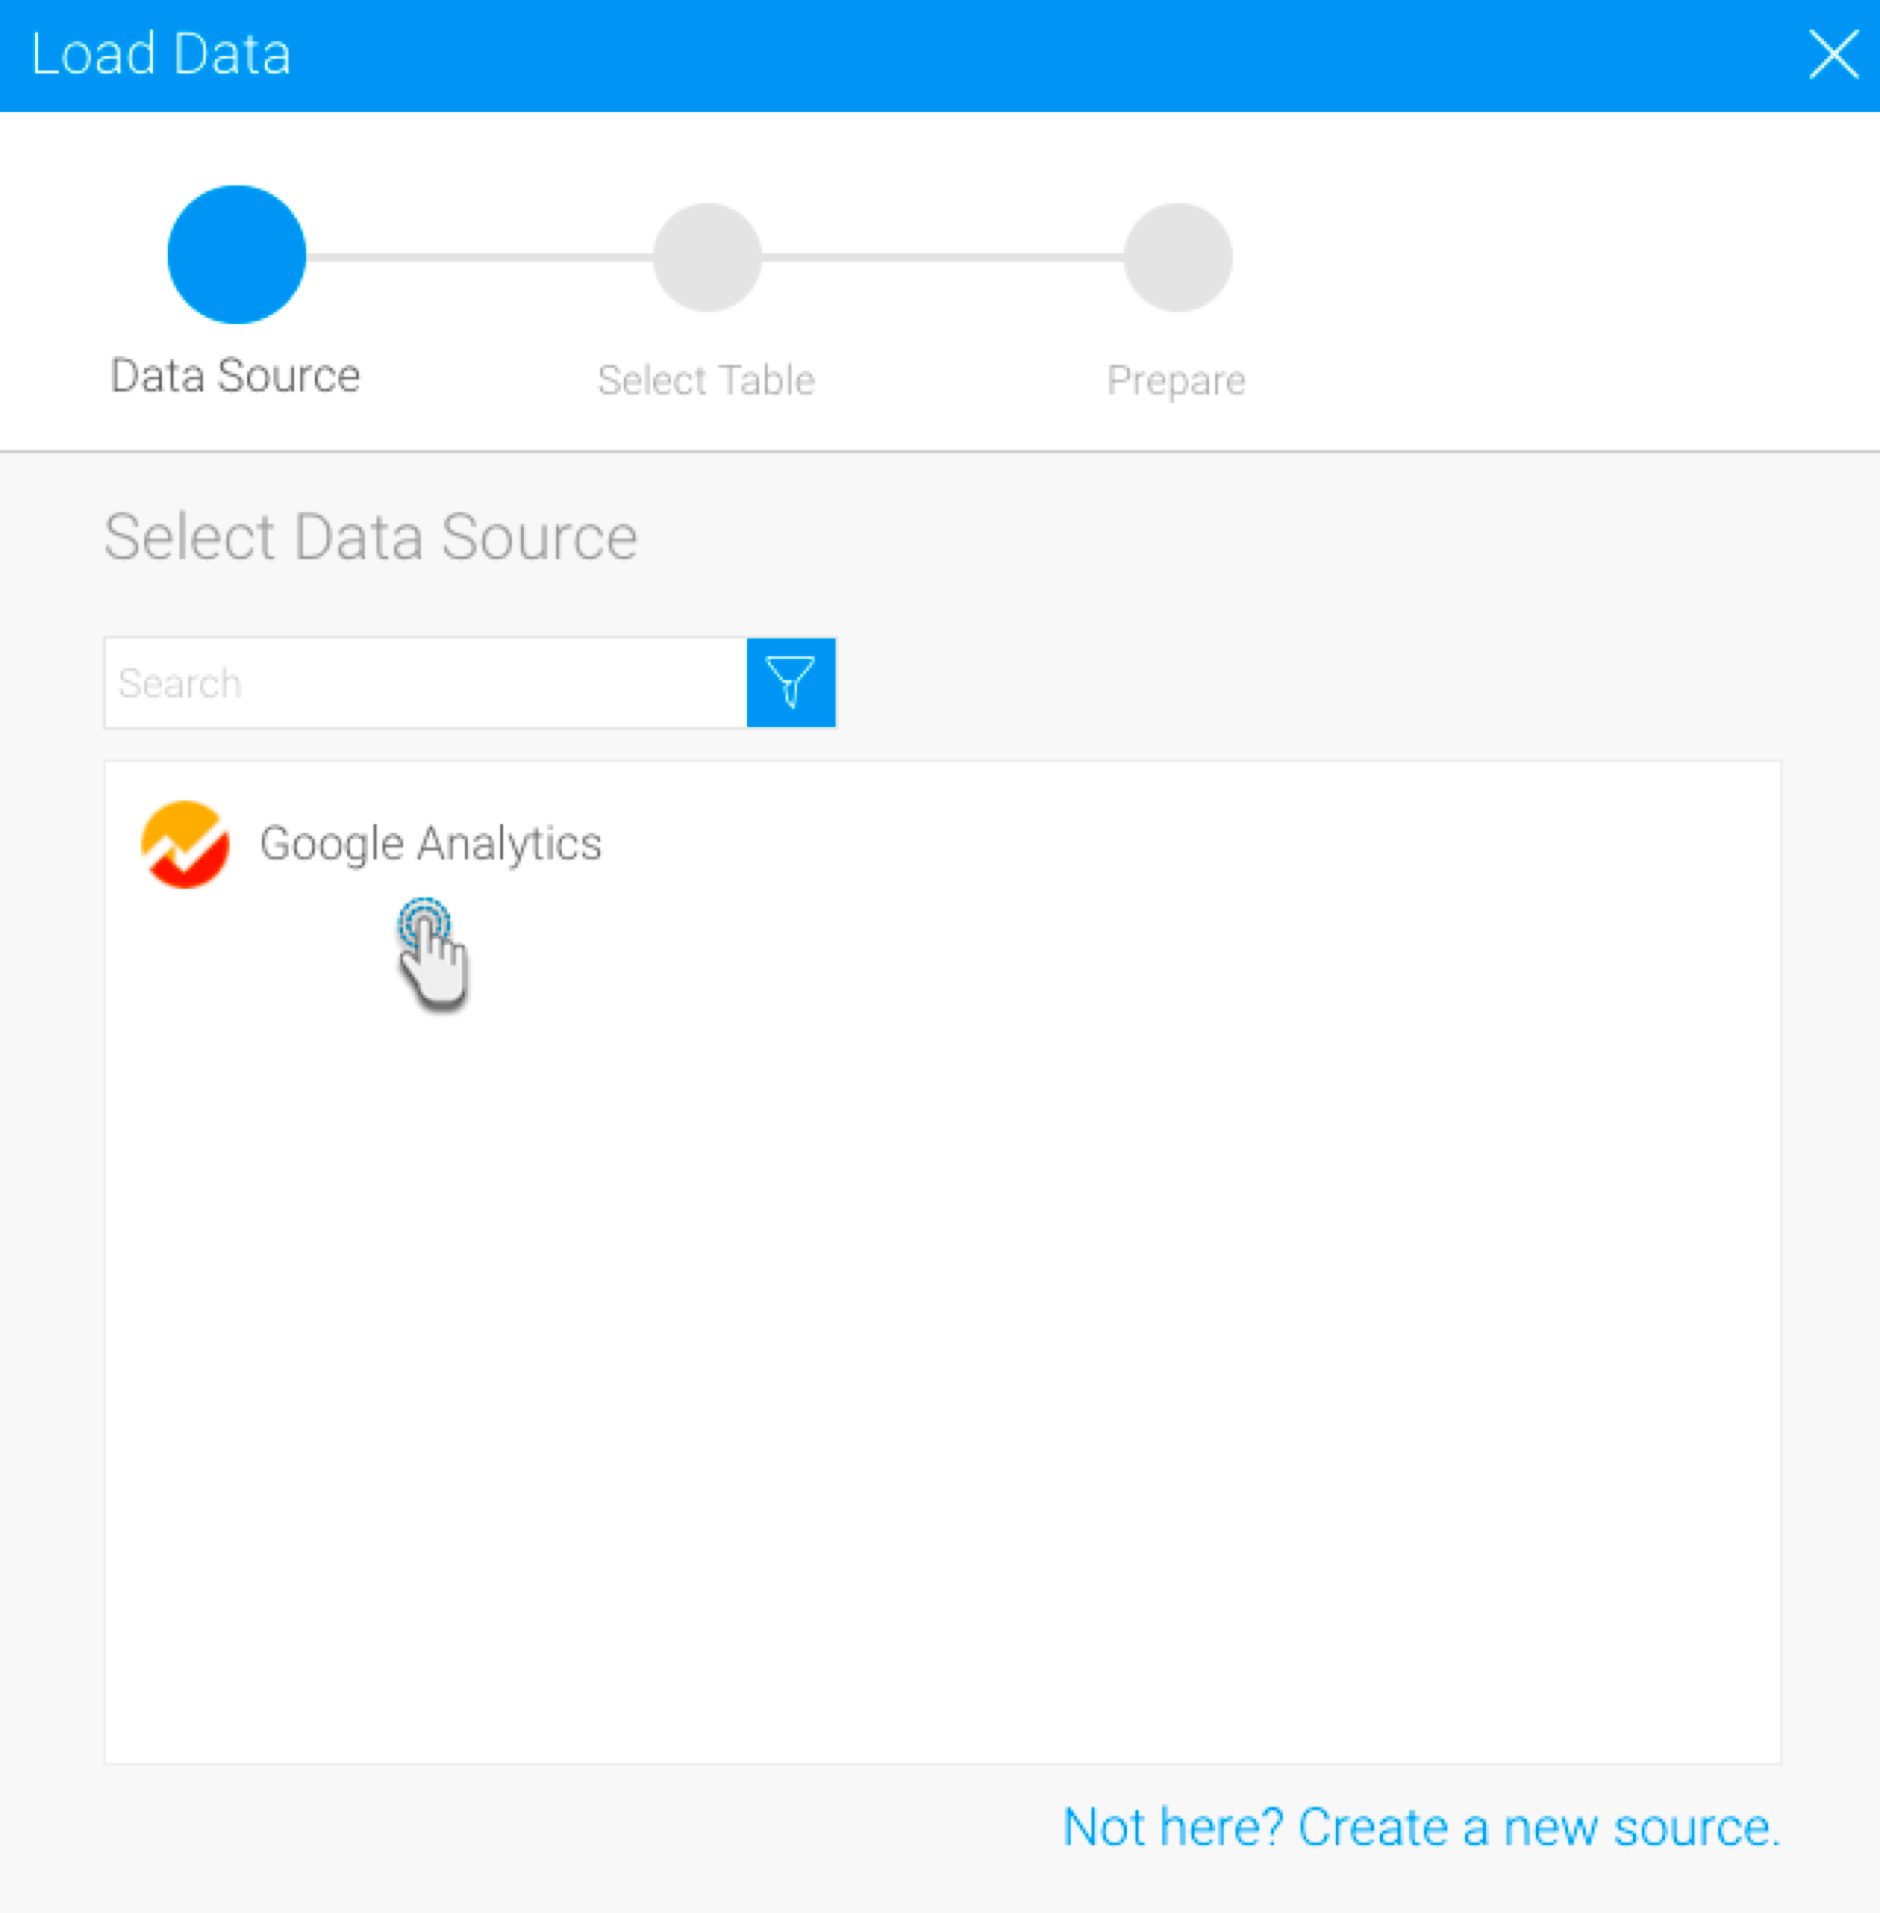
- Choose the data source that you want to use.
- Then select a table from the chosen data source.
- Finally, click Submit.

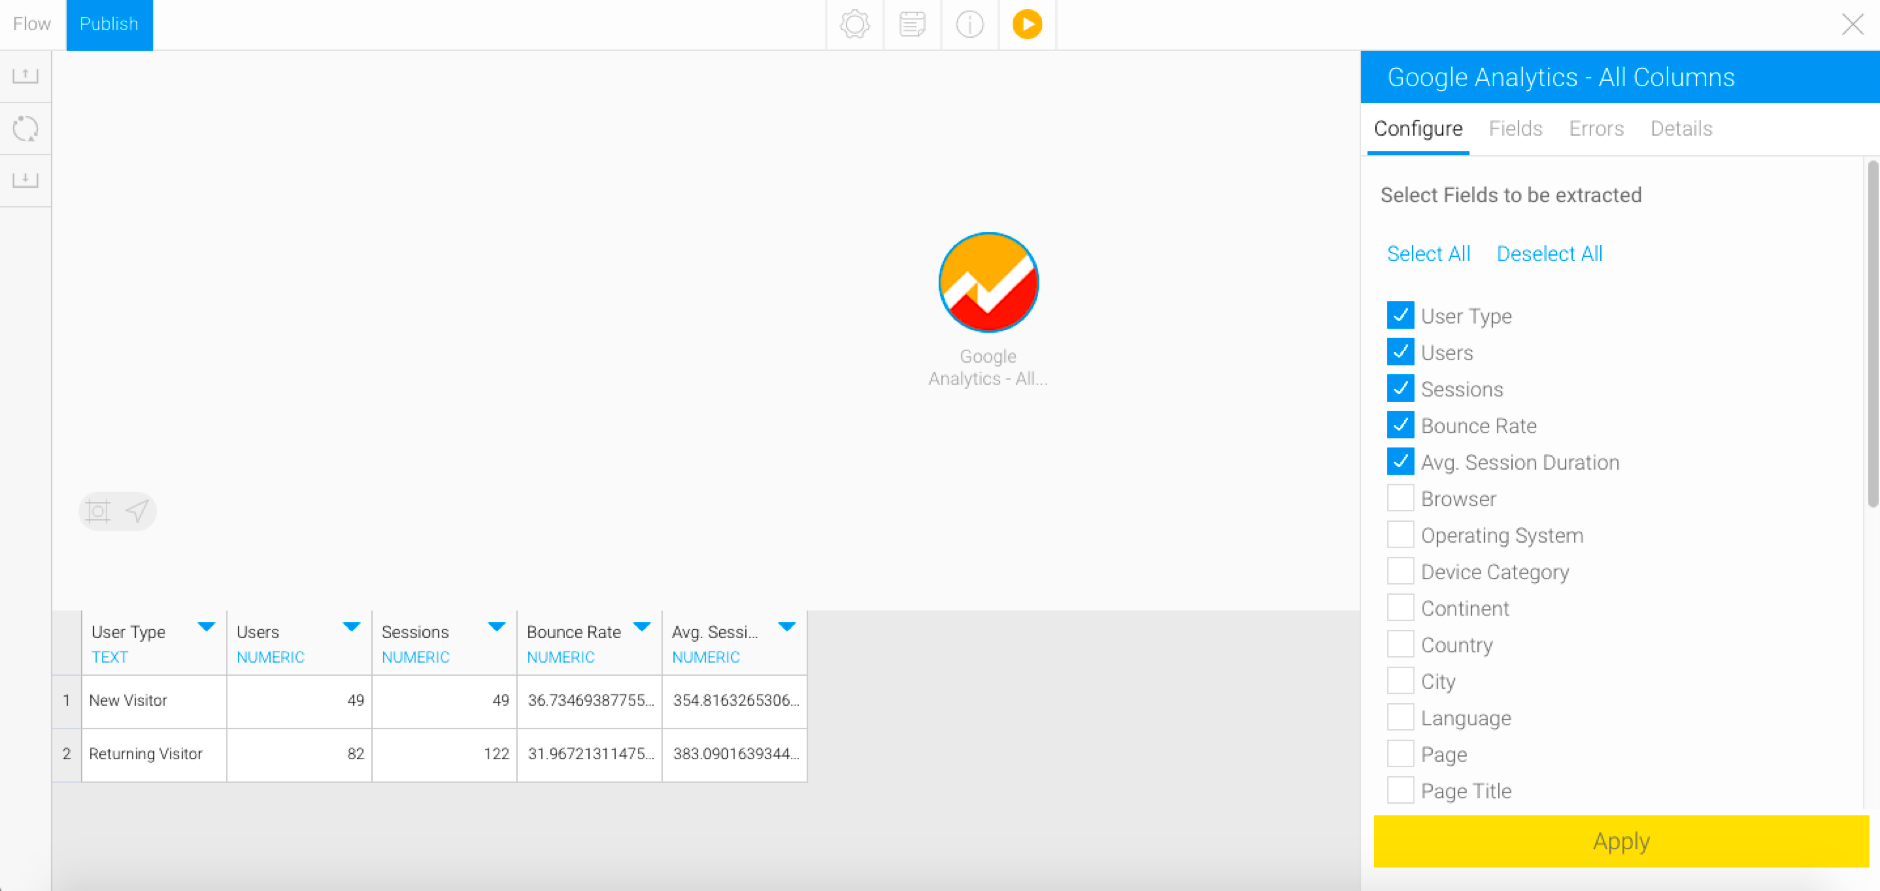
- Next choose the fields that are to be extracted.
- If the connector has any mandatory filters, provide details for them. For example, when extracting data from a Google Analytics table, you will need to provide the start and end dates to filter your data.
- Click on the Apply button. The extracted data will appear in the data preview panel.