Overview
In this example, we will cover how to create a simple transformation flow that aggregates data. This flow will involve setting up an input step, adding the Aggregate transformation step, and then storing the data into a database, using the output step. You could always include more steps to your flows. Click here for a list of all the input steps and here for all the transformation steps.
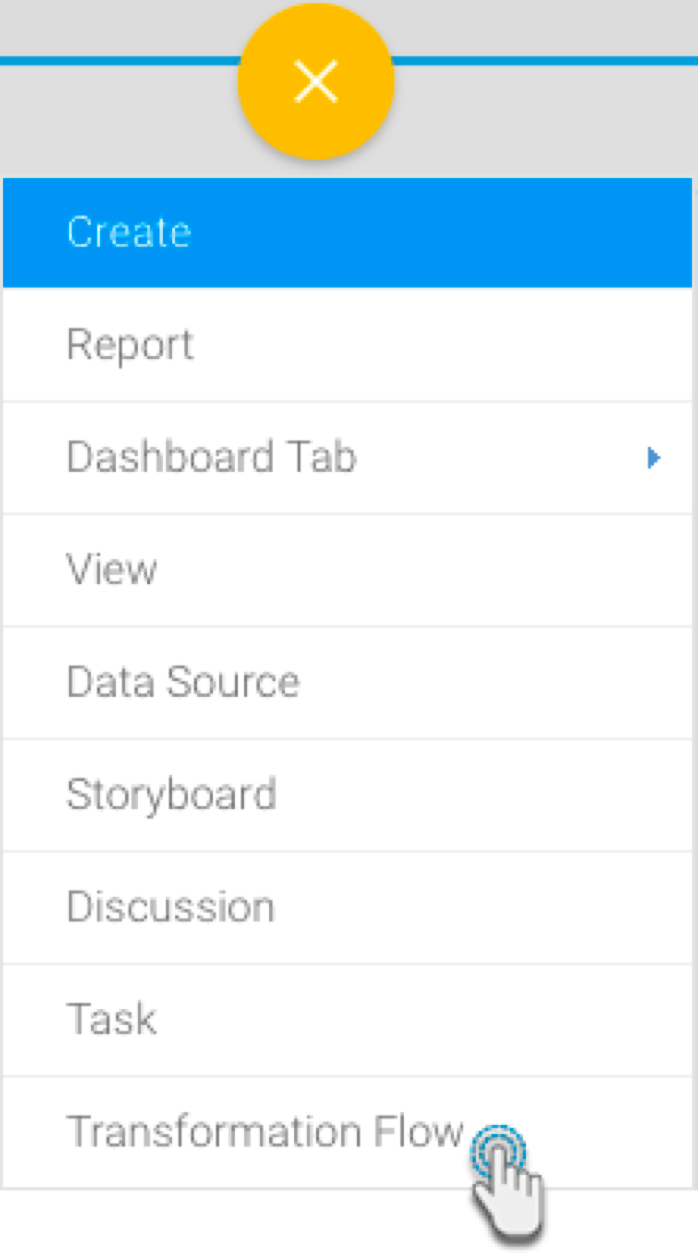
Click on the Create button in the top-right corner.
Then select Transformation Flow.
If you do not see this option, you may not have security access to transformation flows. Learn how to get access here.
You will be taken to the transformation flow builder.
Hover your cursor over the Input Steps button on the left side. A panel with a list of all data extraction steps will appear.
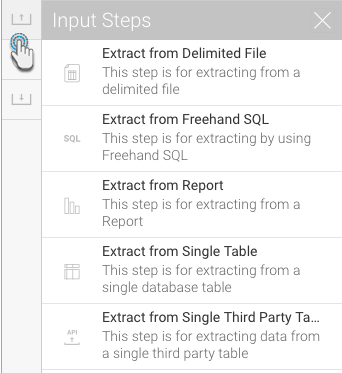
Drag one of these steps onto the canvas. (For this procedure, we will use the single database table as an example. Click here to learn about the different input steps.)
On doing so, a popup will appear, requiring information on the selected data source.

Select the data source, and then a single table (since our selected input was a single table).
Then click on the Submit button.

Next, click on the newly created input step in the canvas. Its details will appear in the configure flow panel.

Note: Clicking on a blank space in the canvas will show details of the entire flow, but clicking on a specific step shows only that step’s configurations.
If required, you can rename the input step. Click on the Details tab in the Configuration panel, and provide a new name, or even an updated description.

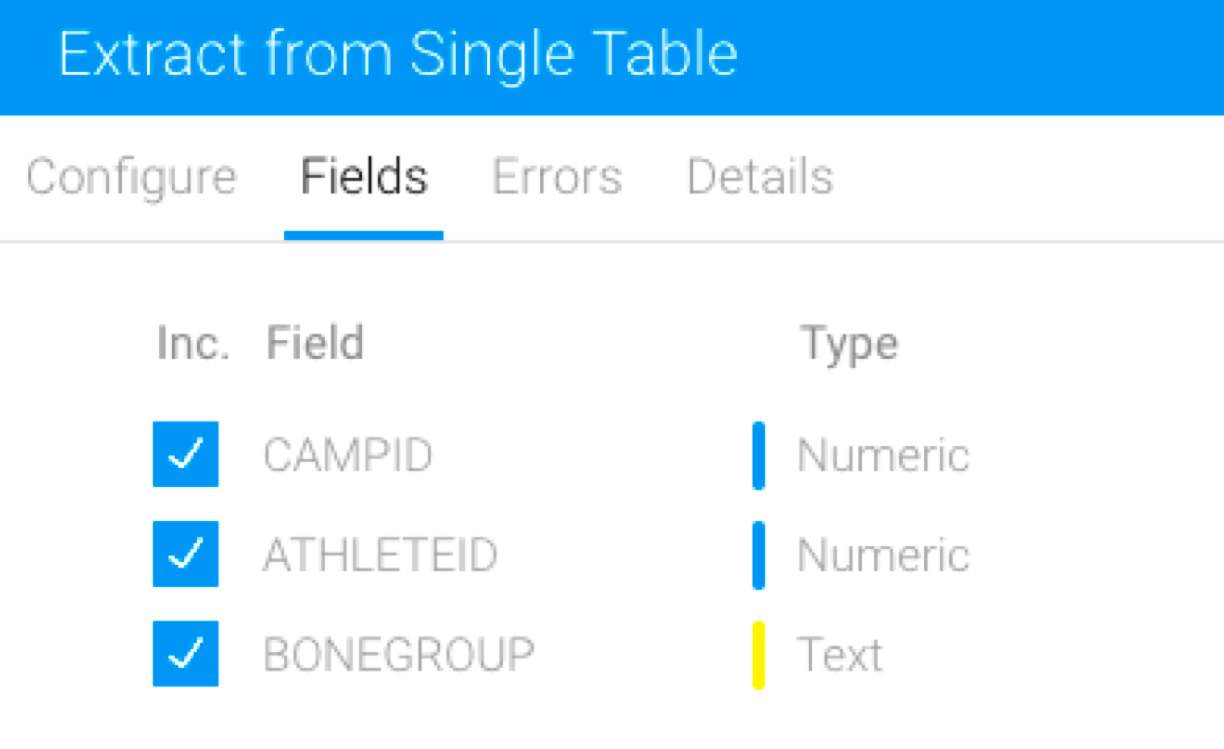
Click on the Configure tab and select only the fields that you want data to be extracted from.
Click on the Add Filter button to apply filters to control the data being extracted, when the Filter popup appears.

Once you’re done with the configuration, click on the Apply button.
You must click on the Apply button to save the configuration details. If you do not click on this button, and click somewhere else first, you will lose the configuration details.

On doing so, the data preview panel will display the data extracted from the configured data source. A maximum row setting of 200 applies.

You can apply transformations to fields directly from the data preview panel. Click here to learn more.
A new Fields tab will also appear in the step configuration panel. Use this to manage the data fields that are extracted from the step.
Next, expand the transformation step panel by hovering on its icon in the step builder, and then dragging a transformation step onto the canvas.

A transformation step will appear on the canvas.

Next, create a connection between the input step and the transformation step. This is done by hovering over an input step to make connecting points appear.

Drag a point and connect it to the transformation step to form a relationship between them. (Click here to learn about rules involving connections, and how to break existing connections.)

Now you can configure the transformation step, by clicking on its icon and using the step configuration panel. (Each transformation step type will be configured differently.)
Save changes using the Apply button.

Note: When a field transformation is made to the data, a Transforms tab will appear in the step configuration panel.

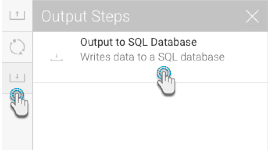
Extend the output step panel by hovering on its icon, and drag an output step onto the canvas.
Next, connect the transformation step to the output step as mentioned above (in part 2, steps 3 and 4).
And then configure the output step through the panel on the right-side. Click here to learn more about configuring this step.
Note: By default, the output step will be highlighted as red to signify that it contains errors. This is because it has not been configured yet.
You can also view the flow’s status in the run logs tab in the flow panel.
Click on the run button in the top header menu to execute the flow. Each step will process the number of rows that has been configured for the design panel (with the max. limit being 200), or until it runs out of data, or if it processes an error. By default, any output to database step will not run. This behaviour can be overridden by enabling the Run in Design mode option in the output step configuration panel. This should only be done subject to the warnings listed earlier on this page.

Once a flow has been created, you can save and publish it. Although you can manually execute draft flow, scheduled flows will have to be published in order to be executed.
Click on the Publish button to do so.

Provide details in the popup that appears.

- Once a flow is created, you can either execute it manually or schedule its execution.