This feature allows you to display dynamic report values, such as the name of the report, its description, etc. in your charts by entering predefined keywords using Yellowfin's text widgets.
Predefined Parameters
You can include the following keywords (in the exact format shown below) in your report. Yellowfin will replace them with their values when you preview your report.
| Parameter | Description |
|---|---|
| [reportname] | Adding this will replace the name of your report in your chart. You can set the report name when you publish it. |
| [reportdescription] | This will show your report's description. You can provide this description when you publish the report. |
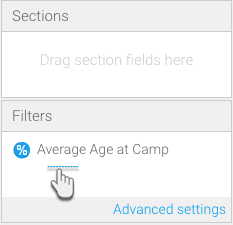
| [filter:<filter_order>] | This parameter returns the filter you have applied in your report. You can include any filter by entering its order number. For example, [filter:2] displays the second filter. Note however, that if a specified filter yields no value, then (None) will be displayed by default. |
| [total:<column_number>] | Use this to display the total aggregation value set on a column field, where the column is specified with its order number in the report. For example: [total:3] will show the total aggregated value of the third column. This value will depend on the aggregation type set on the total of the column field in the report, if any has been defined; otherwise it will display the total Sum value for metric fields, or the total Count for dimension fields. |
| [total:<column_number>:<aggregation_type>] | This is similar to the above parameter, however it displays the total column value depending on the aggregation type that you specify in this parameter. This will override the existing aggregation type defined in the report. Use the following keywords to specify the aggregation type (ensure the same format is used for these keywords, i.e. all capital letters): SUM, AVG, MAX, MIN, COUNT, and COUNTDISTINCT. For example, [total:2:AVG] will display the total average of the second column. Note: For dimension fields, only COUNT and COUNTDISTINCT can be applied. |
Including a Parameter
- Create a report. (See our Report Creation section for more detail.)
Note: In order to use the filter parameter, make sure to include values in the Filters field when creating your report.
- Once you have created your charts (you would need at least two charts), proceed to the design mode.
- Drag a text widget (from the left side menu) onto your canvas, while in the edit mode.
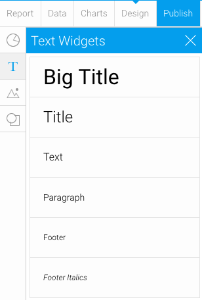
Type in one of the parameters (displayed in the table above).
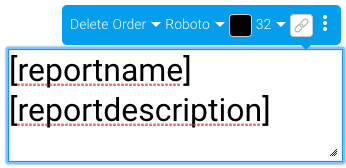
To view the values of some of the parameters, e.g. [reportname] and [reportdescription], you will first need to publish the report and provide the details in the form. Then return to the design edit mode to use the parameters.
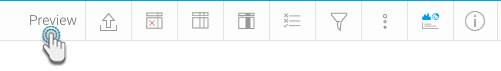
- Then click on the Preview button to preview the report.
- Save any changes, if you need to.
You will be able to see the values of the parameters you have included in the chart in place of the parameter keywords, as shown in the example below.
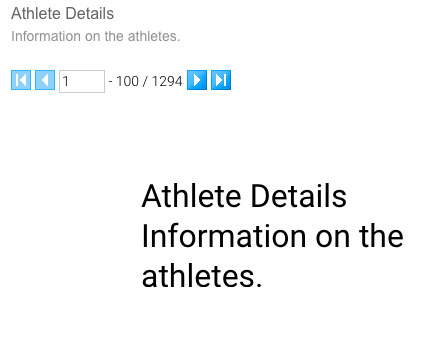
The report will display nothing if the parameters you used have no value.
Styling Restriction
Make sure to apply basic styling when using the parameter keywords. The following formats are accepted:
No styling, for example, [reportname]
Overall styling, e.g. [reportname] or [reportname]
However, any other alteration will not be accepted, such as: [reportname]