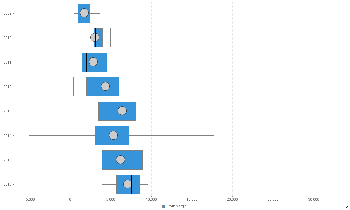
Overview
A chart which gives a quick overview of series of values and their statistical properties.Chart Data Options
Option | Description |
|---|---|
Horizontal Axis | Select at least one metric to analyse in the chart. |
Vertical Axis | Select a label to split your series up by. |
Box & Whisker Tutorial
Summary
In order to set up a Box & Whisker Chart you will need:
- Create a report with chart display
- Select a field to use as the Vertical Axis
- Select a field to use as the Horizontal Axis
- Enable the display of duplicate records
- Create your chart, selecting Box & Whisker as the type under the Analytical heading
- Provide the Horizontal and Vertical axis options
- Customise the Chart as required
- Proceed to the Output step
- Save your report
Tutorial
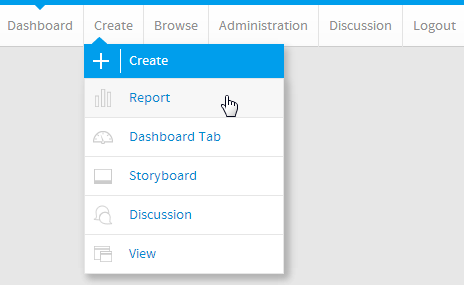
1. Click the Create link in the main navigation bar of the system, and select the Report option.
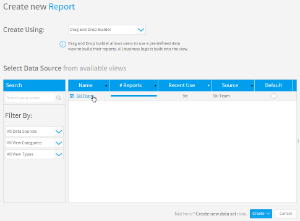
2. You will now be on the Report Initialisation page. Ensure the Drag and Drop Builder has been selected to use for report creation.
3. Click on the Ski Team view in order to use the fields defined within it for creating the report.
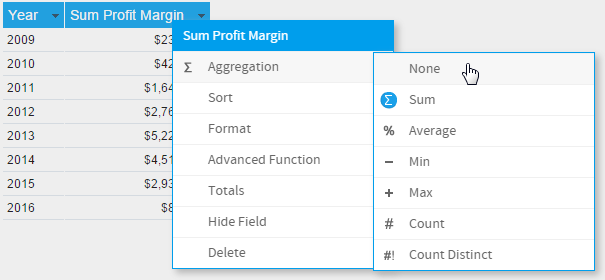
4. Add Year and Profit Margin to Columns.
5. Add Booking Status to Filters.
6. Remove the aggregation applied to the Profit Margin field.
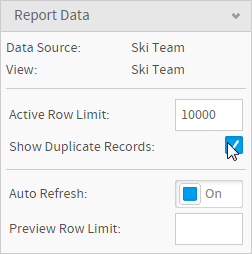
7. Enable the Show Duplicate Records option.
8. Open the filter Settings menu.
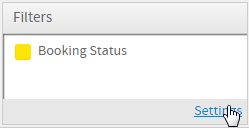
9. Set Booking Status to be Equal to Active.

10. Proceed to the Charts step of the builder.

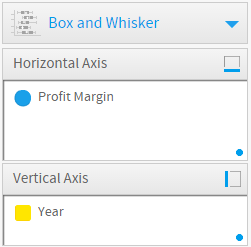
11. Select the Box & Whisker chart from the Analytical section of the charts panel on the right of the screen.

12. Set the following components:
- Horizontal Axis: Profit Margin
- Vertical Axis: Year
13. Save your report