Overview
Guided NLQ provides easy access to data through asking questions, but not all questions are simple. That’s no problem with Guided NLQ. On this page, we’ll explain some extra key features to make sure you get the answer to any question.
Refine your question with a focus area
Your system administrator may have set up focus areas with your data, to help you ask a more refined question of your data without any extra effort.
For the steps below, you will need to pick a data set that already contains focus areas. The Yellowfin training data, Ski Team, contains some focus areas, and we will use it as an example in the following steps.
In these steps, goal is to show a chart of broken bone types of age when the demographic is family, and then refine the results to display only Europe and Africa (EMEA).
- Ensure you’re ready to ask a question in Guided NLQ and that you can see a dropdown for focus areas
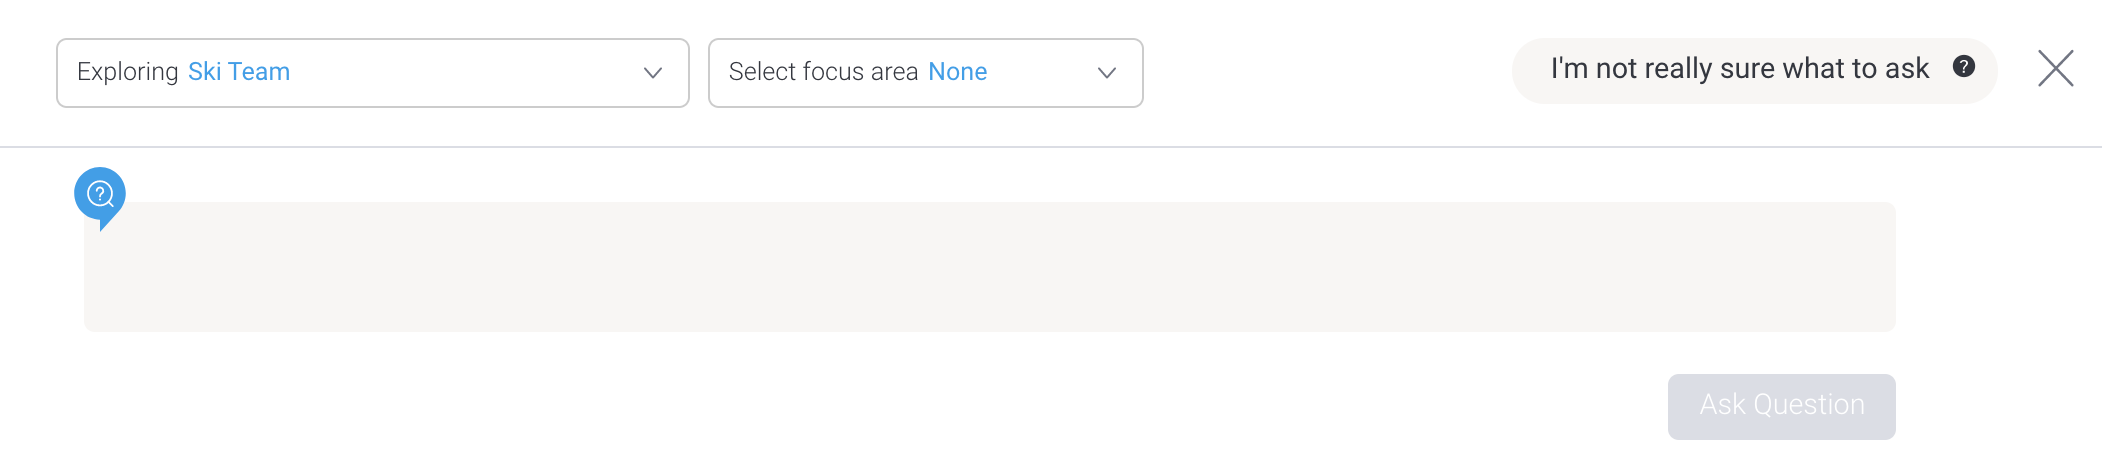
- Click on the Select focus area dropdown to see a list of available focus areas

- Select a relevant focus area: if you’re using the Ski Team data, select Under 18s EMEA with your mouse
- Type the following query into the question field:
For All Time List Broken Bone Groups by Age at Camp (Average) Where Demographic Is Family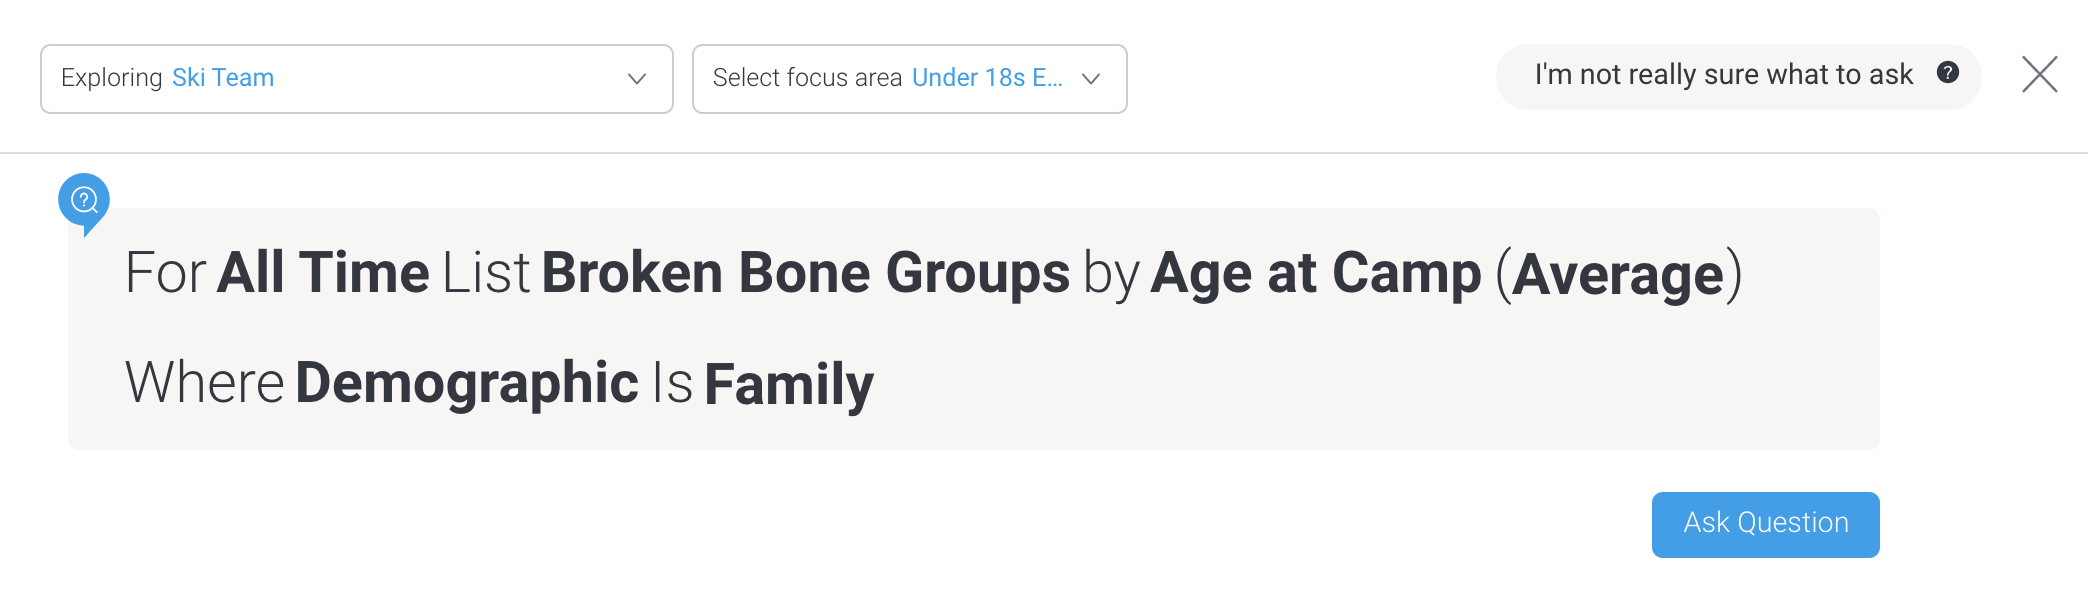
- Click the Ask Question button to display the result
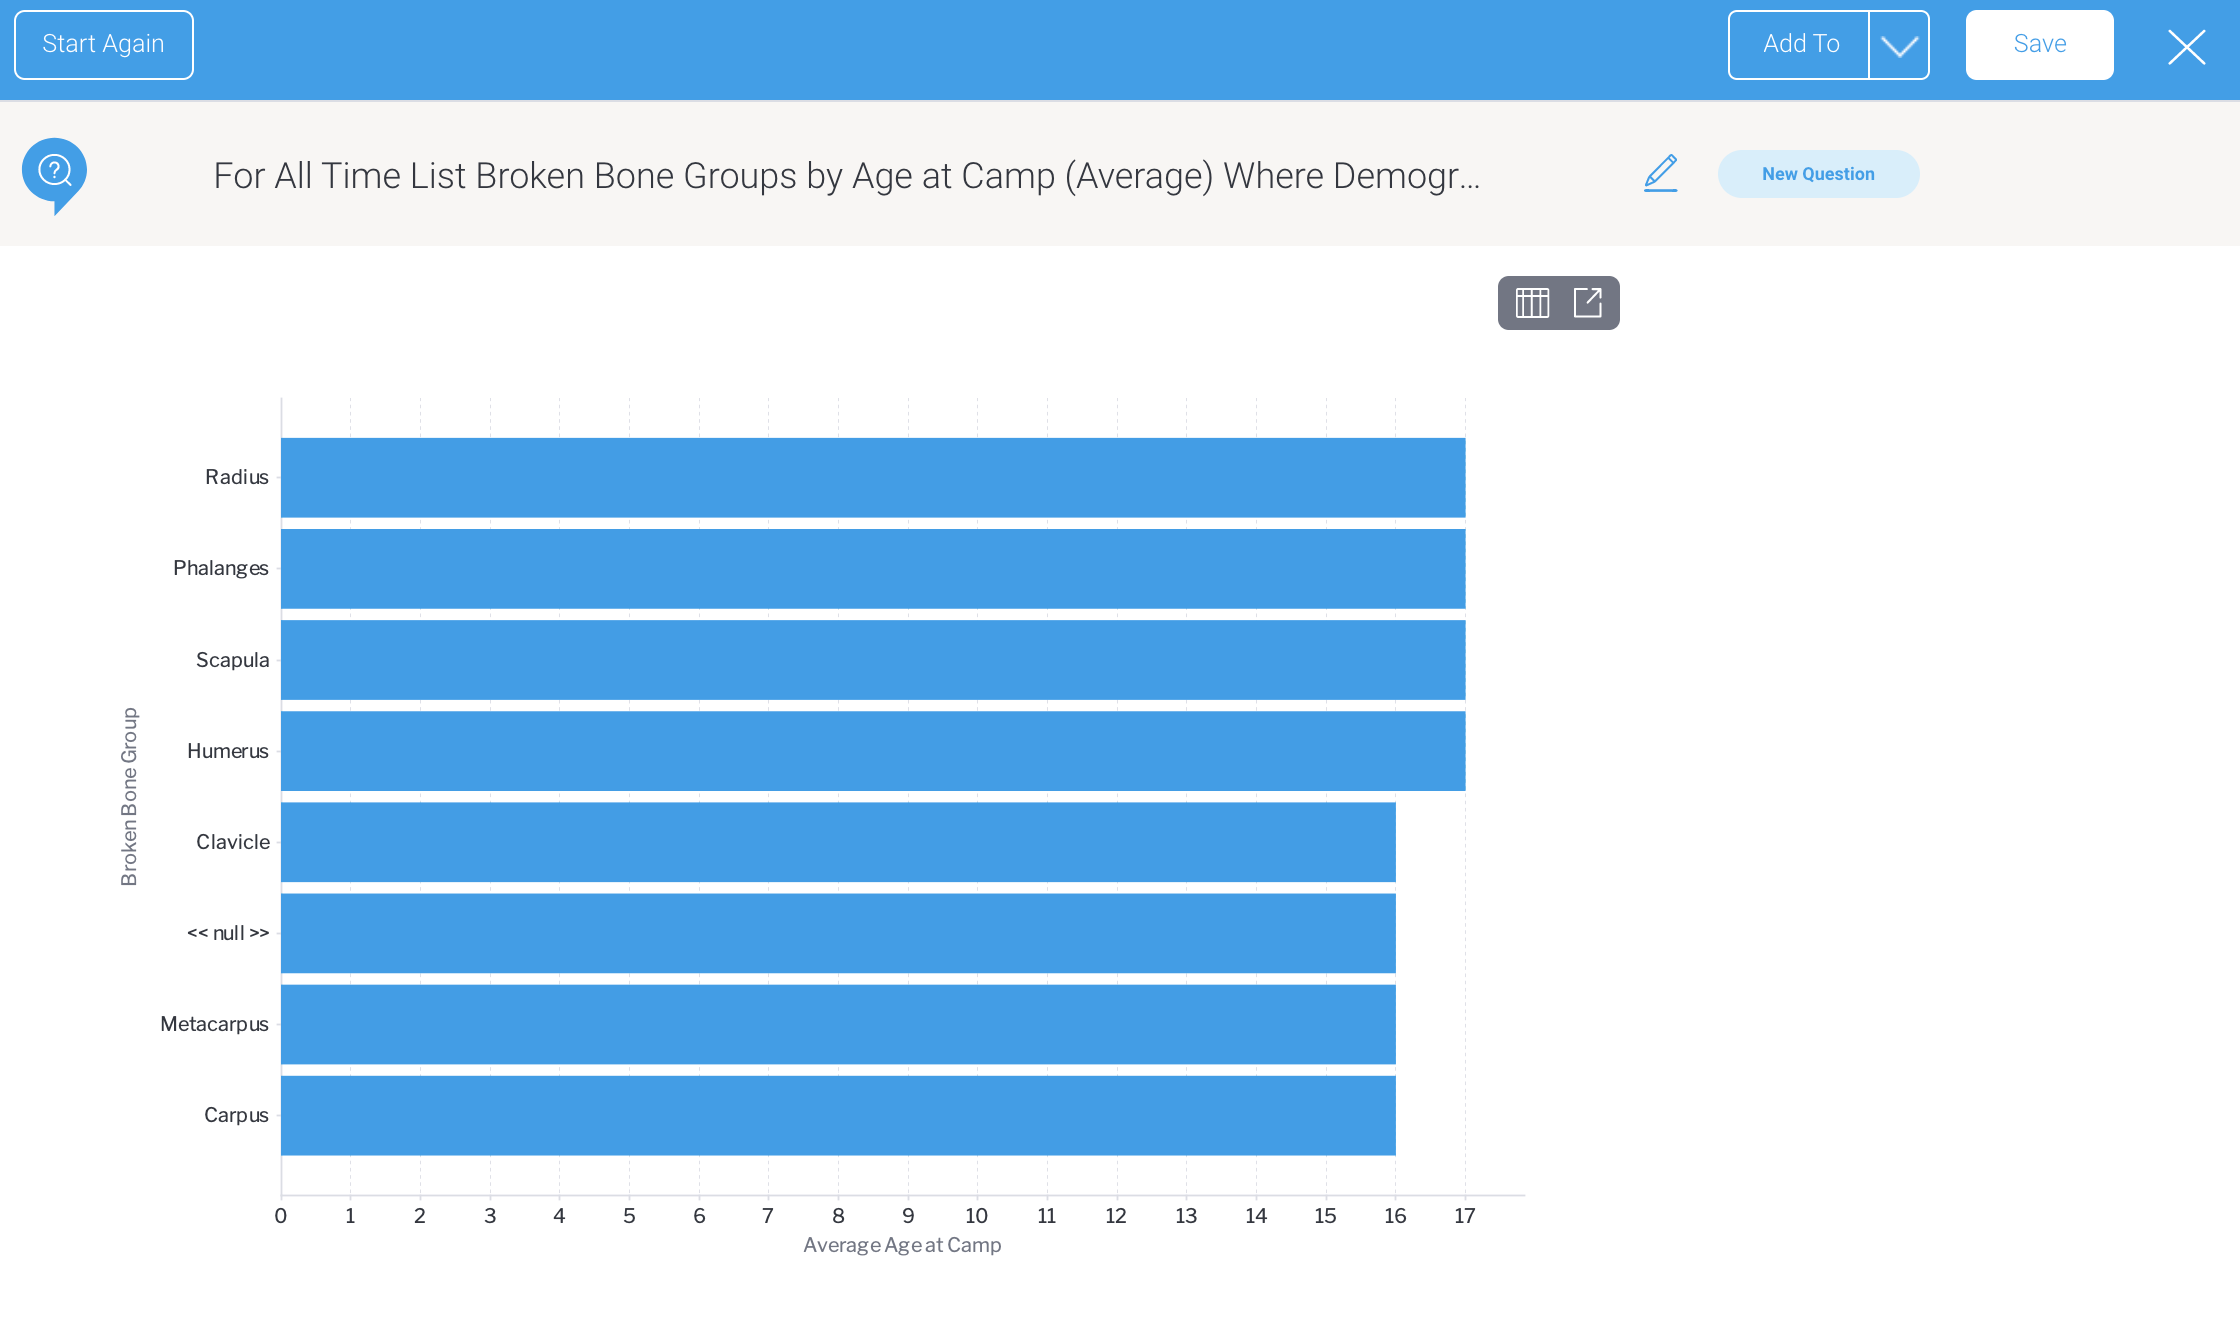
To see the difference, we’ll edit the question and remove the focus area - Click the Edit tool
 to edit your question
 - Click on the Select focus area dropdown again and select None at the top of the list

- Click the Ask Question button again to display the results without a focus area
The answer will display results from all regions rather than just from EMEA, as indicated by the extra numbers for each bone break type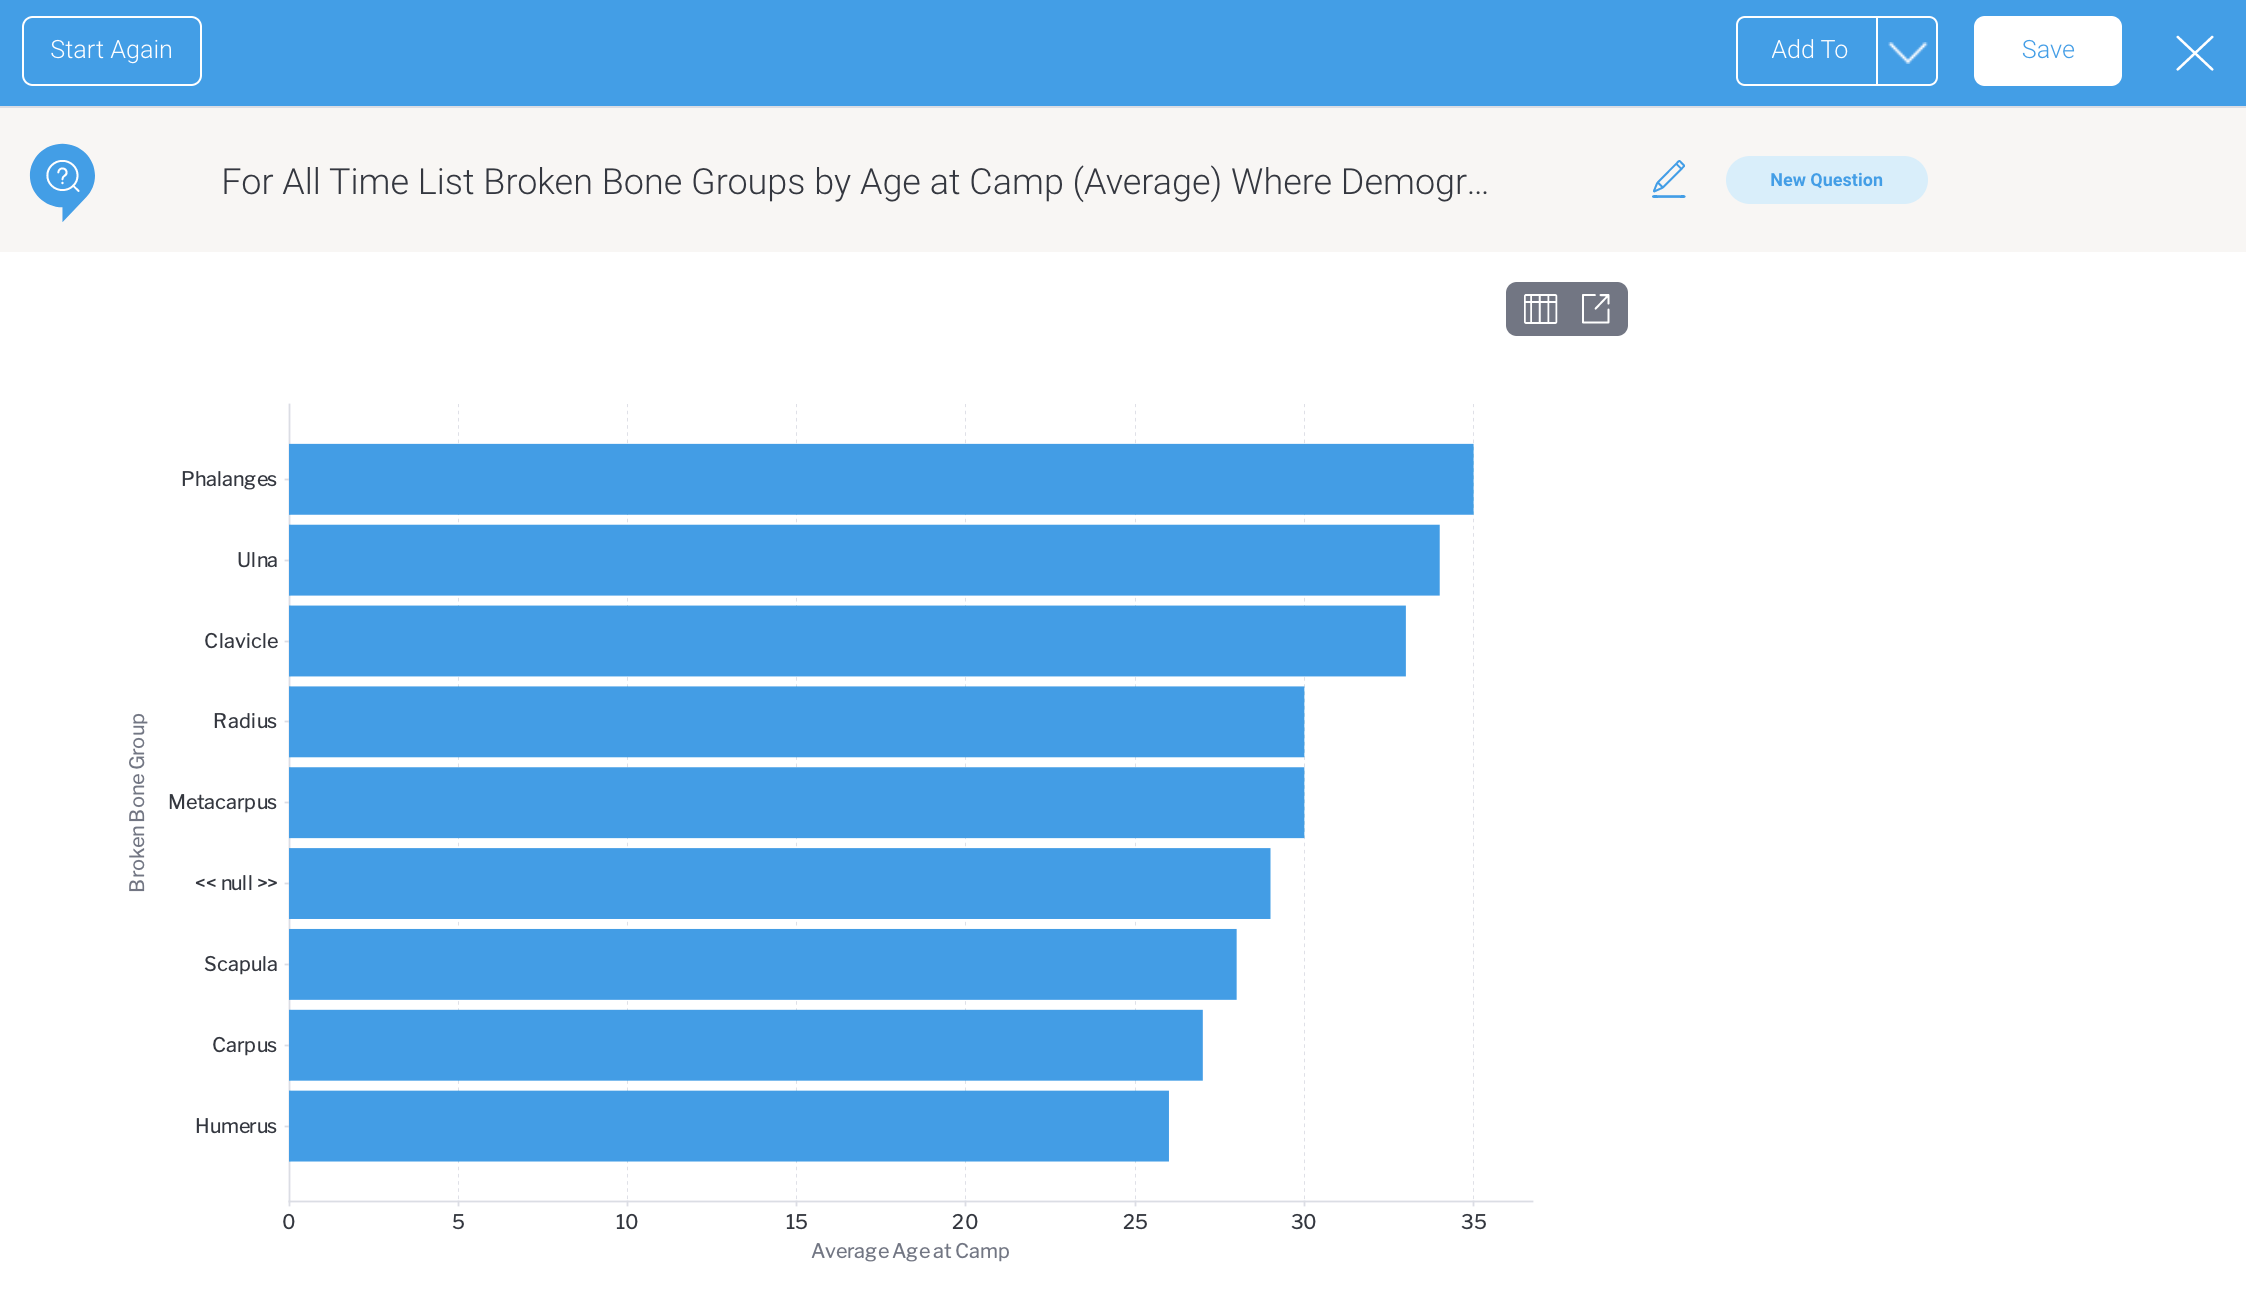
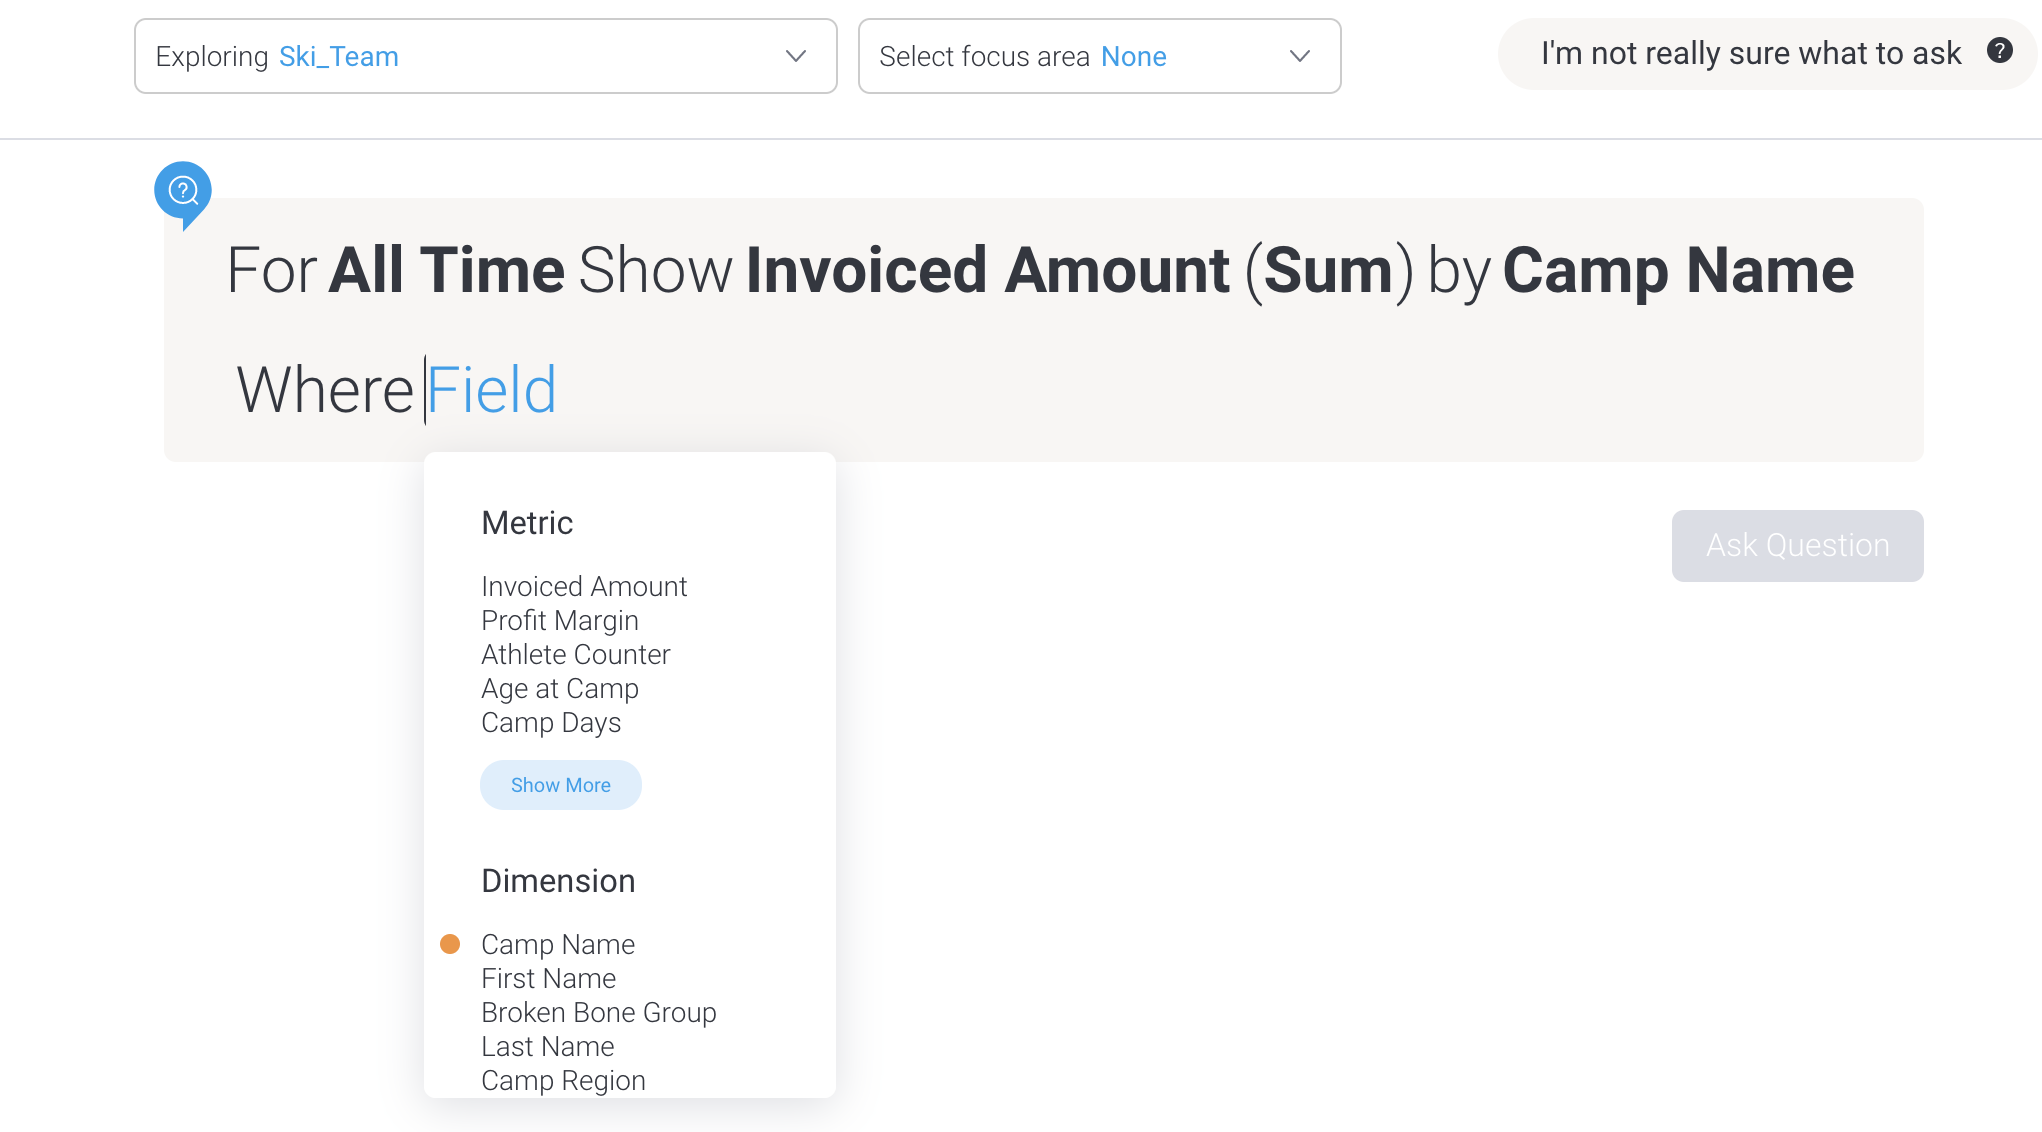
What are these orange dots?
Sometimes, you might see an orange dot next to an available field when you’re asking a question. An orange dot indicates that a field is required, and is displayed as part of either a time frame block or a Where block.
If you see an orange dot next to a field, make sure that you include it in your question. Without it, you won’t be able to ask the question.
Your system administrator may have chosen to include mandatory filters to help refine your answers, such as choosing a specific geographical location or an invoice date field.
Why won’t my result display as a chart?
When your question produces lots of results, Guided NLQ might display those results as a table instead of a chart.
To display a chart, you will need to edit your question so it produces fewer results. The following list contains the limits for different chart types.
- 50 vertical bars.
- 20 series on a line chart.
- 40 bars on a waterfall chart.
- 40 segments on a heat grid.