Overview
Tooltips are a great way of finding out values of data points. Hovering the cursor over a chart point will reveal the tooltip to reveal exact values and interact with the data.
Here are some of the functions you can perform using the tooltip:
You can view the exact value of a data point, or multiple data points using the tooltip. On making the tooltip appear, you will be able to also view any functions that can be performed.
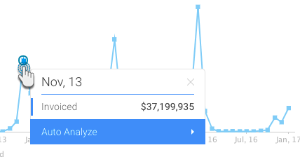
- For a single data point, simply hover your cursor over a point or bar in a chart to make the tooltip appear.
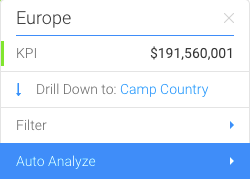
- Then right-click to extend the tooltip.
- The tooltip will clearly indicate the exact select value name (date, region or any type) and provide its value.
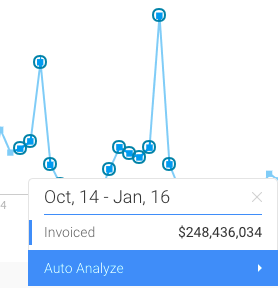
- But to discover the values of multiple data points, select them through brushing (dragging and selecting).
- The tooltip will display the exact values of the selected points with their combined result.
You can filter data on a chart by using these options.
| Option | Description |
|---|---|
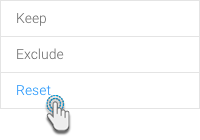
| Keep | This saves the selected data point and removes the rest. Note: keep works best for big charts when you want to select a few values and keep them. |
| Exclude | This deletes the selected point(s) and keeps the rest. |
| Reset | This appears when a chart has been filtered, to undo that action and go back to displaying the original chart data. |
- Make the tooltip appear on a selected data point(s), and select the Filter option.
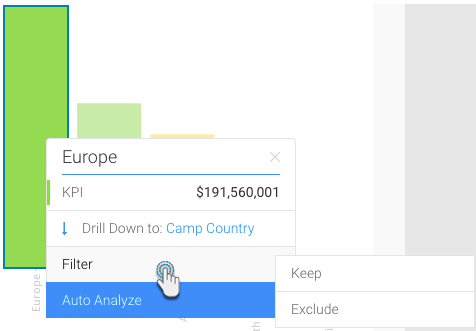
- Click on Keep to save the selected data. The rest of the content will be removed from the chart.
- Or click on Exclude to delete the chosen data. It will disappear from the chart.
- On performing either of these actions, a new option will be added to the Filter menu called Reset.
- Use this to undo the filtering done on the chart. The chart will go back to its original form.
If a chart has drilling information (click here to find out more about this), then the tooltip will display the type of drilling, and then next level the data goes to.
- Ensure that the chart has drilling capability.
- Make the tooltip appear on a single data point, and choose the Drill option.
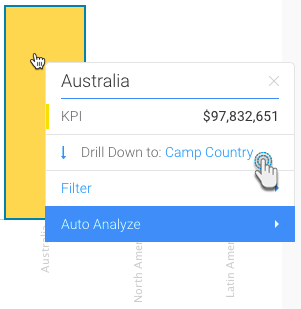
- Our example above shows that the drilling functionality is a Drill Down, and the next level the data will drill down to is Camp Country.
- If you perform bring up the tooltip in this next level, it will reveal more drilling options.
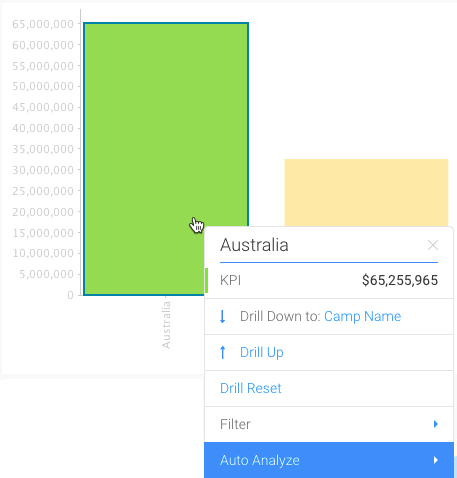
- Click on the next drill down option to go further down the data hierarchy.
- Or click Drill up to go back to the previous level.
- You can always use Drill Reset to go back to the original chart content.