Page History
...
- Click the Create
 button and select “Report”.
Note: If you don’t see the Create button in the top right corner, open the Burger Bun. You’ll see a yellow Create option. Open and select “Report”.
- Select the “Getting Started View” you created earlier in the View section.
You are taken to the Report Builder Data section. On the left panel are the folders you created in the Preparing the View section. When you click on a folder, you’ll see each field you selected in the View section.
Additional Learning: See more information on the Report Builder Data section and fields.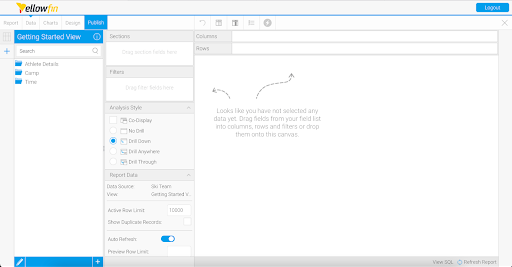
...
Note: If your “Region” column does not show blue text hyperlinks, make sure that under Analysis Style, “Drill Down” is selected. If it is enabled and the “Region” column still isn’t hyperlinked, check that you’ve properly configured your hierarchy in the Preparing the View section.
- Interact with the Drill Down by clicking on “Europe” in one of the rows. The column changes to show only European countries.
To show all the regions again, select “Start” in the breadcrumbs above the Table.
Continue to create visualizations using the fields in your Table.
Additional Learning: See more information on Drill Downs.
...
- Click the Create
 button and select “Report”.
 - Select the “Getting Started View”.
- Drag in “Year”, “Camp Region”, “Camp Demographic”, “Camp Rating”, and “Invoiced Amount”.
Add Defined Value Filters
...
In the next section, you will build a Dashboard using these three Reports and their Charts.
...