Page History
...
| Table of Contents | ||
|---|---|---|
|
Overview
A view is a metadata layer used by Yellowfin to hide the complexity of database structures from report writers. The view is used to define which columns in your database you wish to make available for building reports. These fields may come from multiple tables and therefore will require joins to be defined (the business logic that links rows in a table together).
The two major steps in creating a view are:
- Relationship entity diagram — selecting the tables you need from your database and defining how data in these tables are joined
- View field selection — defining which fields you wish to make available from these tables and providing metadata for them
See Views Overview for more information.
Creating a view
You can create a view based on an existing data source or from a new data source that you have access to connect to. Make sure you have the required details of any new data sources before you begin.
Views can consist of one or more tables, and advanced users have the option of using Freehand SQL. In the steps below, we will create a new view with multiple tables, which automatically opens the View Builder.
- Click on the Create button
 in the top right corner of your screen
 - Scroll down to the View menu item and click on it

The Create New View dialog box will appear, where you can choose an existing source for your new view, or create a new one
We'll use an existing sample data source, Ski Team, in these steps - Click on Ski Team from the list of data sources
The next step will appear, where you can choose the components of your new view
- Click on the radio button for Multiple Tables
A warning message will appear
- Click on the Create View button to launch the View Builder window

- Double-click on the text New View in the top left corner
- Type Tutorial View and then press your tab button to rename the new view

Yellowfin automatically saves your updates, but if you can also manually save your view as a draft at any time, allowing you to save your new view to a particular folder - Click on the Publish button to display the Save View dialog box

- Triple-click on the phrase New View and type This view will be used to learn about Yellowfin

- Click on the first dropdown that displays - - Select - - and select Tutorial from the list
- Click on the next dropdown that displays - - Select - - and select Training from the list

- If you typically use optional tags and wish to add some now, click on + Add tags and add your tags
- Click on the Save As Draft button to save your view in draft format
Yellowfin will close the draft and take you back to the Browse page, where you can see your new draft view
...
| Class | topLink |
|---|
Creating entity relationships
Building entity relationships is one of the key purposes of the View Builder. This allows you to define all the key relationships between your selected database tables.
- Double-click on the draft view you created in the previous steps to edit it in the View Builder
- From the table list on the left of the screen, find the table ATHLETEFACT and drag. and drop it onto your canvas

- Repeat step 1 to add the CAMP and PERSON tables to your canvas

- Click on the Create New Join
 tool on the ATHLETEFACT table
The New Join dialog box will be displayed
- Use the dropdowns to create the following join:
Join Type: Inner Join
Cardinality: One to One
Join To: Person
- In the Join Details section, click on Detect Joins to prompt Yellowfin to automatically detect the join

- Click on the Save & Close button
The join will now be displayed as a line between the two tables, and hovering over the join icon will display the logic in a tooltip
- Repeat steps 3 to 6 to create a similar inner join between ATHLETEFACT and CAMP where CampId = CampID

- Drag and drop one of the three tables to a new location on the canvas: you can move these around as needed to make any diagrams easier to read as you add and join more tables

See Model for more information.
...
| Class | topLink |
|---|
Selecting fields
From the View Builder you can select which fields to make available to end users for reporting. Only columns selected from each table in your Unattached list will be available for reporting.
- Ensure your new view is loaded in the View Builder and that you've created any entity relationships (if not, follow the previous steps)
- Click on the expand tool
 for the AHTLETEFACT table to expand the list of table columns
- Click on the Edit Table Properties tool
 to see the table's properties displayed in the panel on the right of the screen
- Click on the expand tool
 for the Columns section to see the list of columns
- Check the checkboxes for AGEATCAMP, AGEGROUPATCAMP, COST, DEMOGRAPHIC, INVOICEDAMOUNT, INVOICEDATE, INVOICEESTIMATE and PERSONID

- Click on any Edit Table Properties tool once more — to refresh the display of the columns on the canvas
The columns you selected will now appear in bold
- Repeat steps 1 to 5 to select the following fields for the CAMP table:
CAMPDEMOGRAPHIC
CAMPDESCRIPTION
CAMPREGION
ISOCODE - Repeat steps 1 to 5 to select the following fields for the PERSON table:
DATEOFBIRTH
GENDER
ISOCODE
REGION
Your tables and columns are now ready to be prepared.
See Table Properties for more information.
...
| Class | topLink |
|---|
Setting field folders & meta data
Initially in the preparation phase, fields selected from the previous steps (the modeling phase) will be in the Unattached panel in folders that represent the tables that they originated from. Assigning fields to folders lets you organize your fields in a way that is logical for the report writer, giving you the chance to group them differently to how the columns were grouped in the table structure in the data source.
Assigning a field to a folder associates meta data with that field so that report writers will be able to view and use the field when they build reports. Without that meta data, a field won't be available in the Report Builder.
You can assign fields to folders in the Available Fields panel. In the steps below, we'll show you how to add folders and then assign fields to them.
- Ensure you have completed the modeling phase for your new view (if not, follow the previous steps)
- Click on the Prepare tab

Your view will change to a tabular layout, showing you the contents of each column
- Click on the Create
 tool in the bottom left corner, then click on Add/Edit Folders from the list
The Field Folders dialog box will appear, where you can create new folders, delete existing folders and and add fields to existing folders
- Hover over the Dimensions folder
The burger bun on the left lets you reorder the folder by dragging and dropping, and the red X on the right lets you delete the folder
- Click on the Select dropdown and click on Athlete
The column will now appear in the list of field folders
- Repeat step 5 to add Athlete Location, Athlete Payment, and Camp

- Click on Add Field Folder to display a new empty field and type Date Fields

- Click on the Add button to add the new field folder to your field folder list
- Click on the Submit button to add the columns as field folders
The view will now show the added field folders in the field/folder list in the panel on the left
Now that the folders exist, we can add some fields to them - Click on the Create tool, then click on Add Fields
A new panel will appear further left that lists the related table names, which can be expanded to display the table fields
- Click on the ATHLETEFACT table to expand it
- Drag and drop the following fields individually to the Athlete folder (or use your usual keyboard/mouse combination multi-select them): AGEATCAMP, AGEGROUPATCAMP and DEMOGRAPHIC

- Click on the Athlete field folder to expand it
The three fields you just added will be listed
- Repeat the last few steps to add COST, INVOICEDESTIMATE and INVOICEDDATE to the Athlete Payment folder
- Repeat the last few steps to open the PERSON field folder and add REGION and ISOCODE to the Athlete Location folder
- Repeat the last few steps to to add DATEOFBIRTH and GENDER to the Athlete folder

The fields added to field folders in Tutorial View will now be accessible in the Report Builder - Click on the white arrow for Table Fields heading to hide the column
...
| Class | topLink |
|---|
Changing field content display
The View Builder lets you choose how field content should be displayed. For example, you can change those uppercase field names to be more user friendly, and make values display in a more meaningful way. In the steps below, we'll make some basic and useful changes, including updating some reference codes.
- Ensure you have set up your field folders and meta data for your new view (if not, follow the previous steps)
- Use your mouse to scroll to the right of the displayed fields and locate the Athlete Location section

- Click on the field name ISOCODE to select it

- Type Athlete Country and then press your tab key to confirm the field label update

- Click on the triangle next to the field label to display a dropdown list and click on Edit Format

The Field Settings dialog box will be displayed, where you can find all the information associated with a field and update it to suit your needs
- Click on the Details section to expand it, and read through the options available

- Click on the Format section to display the available formatting options

- Click on the Format dropdown and take a look at what options are available

- Click on Reference Code from the list
A new option will become available for you to select what type of reference code should be applied
- Click on the Reference Type dropdown to display a list of available reference codes associated with the Ski Team view, and select Country
- Click on the X in the top right corner of the dialog box to close the box (your changes are dynamically saved)
The Reference Code field will now display country names instead of country codes
- Locate the column within Athlete Payment for INVOICEDDATE and click on it to change its name to Invoiced Date
- Locate the column within Athlete Payment for INVOICEDESTIMATE and click on it to change its name to Invoice Estimate
See Prepare for more information.
...
| Class | topLink |
|---|
Formatting fields
Once you're happy with the basic display of your field values, you can style them further with formatting options such as currency symbols and colours.
- Ensure you're in the Prepare tab of your view and that you're using the tutorial view we set up earlier on this page (if not, follow the previous steps)
- Locate the COST field within the Athlete Payment section and click on the dropdown, then click on Edit Format

- Add a prefix of $ and set Decimal Places to 0

- Further down the list, locate Color and click on the circle and pick red from the options: this will set the default color for the field when used in charts (which can be overridden in each report)
- Click on the Details section and update the Display Name field to display Cost
- Scroll back up to the top of the dialog box and click on the X in the top right corner to close the box (your changes are saved dynamically)
The Cost field values will be updated to display your formatting changes
...
| Class | topLink |
|---|
Setting up calculated fields
Calculated fields let you create new fields based on existing fields. You can use simple calculations right through to freehand SQL for more complex needs. These can be useful for displaying information that's likely to be used regularly in reports, saving the report builder from having to recreate the field at the report level each time. Calculated fields can also be useful when used in conjunction with Guided NLQ, providing pre-calculated fields for your users to include in their queries. In the steps below, we'll create a simple calculation that produces a metric field as output. We'll aim to calculate profit by subtracting the cost from the invoice figure.
- Ensure you're in the Prepare tab of your view and that you're using the tutorial view we set up earlier on this page (if not, follow the previous steps)
- Click on the Create tool at the bottom of the screen, then click on Calculated Field

The Calculated Field dialog box will appear
- In Calculated Field Name, type Profit
- Click on the Field Folder dropdown and select Athlete Payment

- From the Search dropdown, start typing invoice and click on INVOICEDAMOUNT to select it for use in the calculation

- From the collection of calculation tools , click on the minus tool
 to add a minus sign to your calculation
- From the Search dropdown, locate and click on the COST field
- Click on the Validate button to check that your calculation has no errors
If there are no validation issues, a successful validation message will be displayed
- Click on the Save button to save this new calculated field
- Scroll to the left of your field table to check you can see the new field at the end of the Athlete Payment section

See Calculated Fields for more information.
...
| Class | topLink |
|---|
Building date hierarchy fields
Date hierarchy fields are essentially calculated fields that let you build levels of a hierarchy based on a single date field in your data source. Date hierarchies enrich analysis through more flexible drill down options, a better Guided NLQ end-user experience, and for use with time series charts. Date hierarchies are created by using granularity to dictate day/week/month/quarter/year etc. Read more about date granularity if you'd like further information before performing these steps.
To build a date hierarchy, you must start with a field that already uses a date format, rather than a dimension (such as a string of characters) or a metric (such as a number). Yellowfin's tutorial database, Ski Team, already has a date hierarchy set up for INVOICEDDATE, so we'll use a duplicate of this field that we created in one of the previous steps and we'll create a new set of date fields for a hierarchy.
Building a date hierarchy requires four components, as outlined in the table below.
...
Learning Outcomes
After completing this section, you will be able to:
- Create a View using a data source
- Join tables
- Choose columns to be available for analysis
- Construct calculated fields and drill-down hierarchies
- Format fields
Example Use Case
For the purposes of this “Getting Started Journey”, we are using an example involving a fictional sports training business called “Ski Team”. Their data contains information relating to revenue from various ski camps and the athletes who have attended.
Ski Team would like to analyze their overall financial situation. They want to break down the invoiced amount by dimensions such as customer regions, demographics and gender. They are also interested in understanding which ski camps are bringing in the most revenue this year and how that compares to revenue brought in last year.
About Views
A View is a translation layer used by Yellowfin to hide the complexity of database structures from Report writers. The View is used to define which columns in your database you wish to make available for building Reports. These fields may come from multiple tables and therefore will require joins (the business logic that links rows in different tables together).
Additional Learning: See more information on Views.
Before you can create Reports, Charts, or Dashboards, you need to build a View. Follow the instructions in this section to learn how to create and configure a View.
Note: If you are not already on the Browse page, please navigate there. (Burger Bun ![]() -> Browse All)
-> Browse All)
Create a Multiple Table View
- Click Create
 and select “View”.
Note: If you don’t see the Create button in the top right corner, open the Burger Bun. You’ll see a yellow Create option. Open and select “View”.
- Select “Ski Team” as your Data Source.
Note: For this exercise we will be using the pre-installed tutorial data source, “Ski Team”. After creating Reports and Dashboards using the Ski Team data source, you’ll be guided on how to connect your own data source and build content using your own data. - Select “Multiple Tables” as your View Type. Select Create Viewto enter the Model step.
Additional Learning: You also have the option to create a View from a single table from your database. If the Single Table option is selected, you will be prompted to select the desired table, and Yellowfin will skip the View Builder and take you straight to a draft Report. Additionally, advanced users have the option of using Freehand SQL.
Creating the Model
In the Model step, you will drag in the desired tables onto the model canvas, join the tables, and select columns to be available for Reporting and analysis.
Add “ATHLETEFACT” Table
On the left, there is a list of tables from the “Ski Team” database.
- Drag in the “ATHLETEFACT” table.
This table has information about athletes who have participated in ski camps.
- Select the gear
 at the bottom of the table. In the Table Options on the right hand side, expand the Columns section.
- Select “CAMPRATING”, “DEMOGRAPHIC”, “ENDDATE”, “INVOICEDAMOUNT”, and “STARTDATE” from the list in the Columns tab. Click the gear at the bottom of the table again to update the settings. The columns you selected will now appear in bold.
Note: The selected fields will be visible as your columns when creating Reports. The unselected fields will not appear or be available to build content.
Add “CAMP” Table
- Drag in the “CAMP” table.
You’ll use this table to extract information on the regions and demographics of the ski camps.
- Select the gear
 on the “CAMP” table.
 - Select “CAMPDEMOGRAPHIC”, “CAMPDESCRIPTION”, and “CAMPREGION” as your columns. Click the gear again to update the settings.

Next, join the two tables together.
Join the “ATHLETEFACT” table with the “CAMP” table
- On the “ATHLETEFACT” table, click the join
 icon. This will pop up a window to set up your join.
Note: The Join From needs to be the “ATHLETEFACT” table. If your Join From is the “CAMP” table, click Delete Join, and make sure to select the join icon from the “ATHLETEFACT” table.
- Select “Inner Join” as the Join Type, and “One to One” as the Cardinality. In the Join To drop down menu, select “CAMP”.
Additional Learning: Learn about different join types.
- From the “ATHLETEFACT” table, select the “CAMPID” column to be used to join the tables together. Set the operator to “Equal to” and from the “CAMP” table, select the “CAMPID” column. Click Add, then click Save & Close at the top right corner.

You should now see your model, with the two tables joined together using an inner join.
Note: Hovering over the join icon will display the logic in a tooltip.
Repeat this process for the “DATELOOKUP” table.
Add “DATELOOKUP” table
- Drag in the “DATELOOKUP” table.
This table has one row per date. In the next steps, you will extract a few date fields of different granularities. These will be especially useful in building Time Series Charts later on.
- Select the table’s gear icon.
- Select “MONTHDATE” AND “YEARDATE” as the columns. Click the gear on the “DATELOOKUP” table again to save the changes.

Join “ATHLETEFACT” table with “DATELOOKUP” table
- Select the join icon on the “ATHLETEFACT” table.
- Select “Inner Join” as the Join Type, and “One to One” as the Cardinality. In the Join To drop down menu, select “DATELOOKUP”.
Note: Again, the Join From needs to be the “ATHLETEFACT” table. - From the “ATHLETEFACT” table, select the “INVOICEDDATE” column to join the tables together. Set the operator to “Equal to” and from the “DATELOOKUP” table, select the “DAYDATE” column. Click Add, then click Save & Close at the top right corner.

Note: You can move the tables around as needed to make the diagrams easier to read as you add and join more tables.
Add “PERSON” table
- Drag in the “PERSON” table.
This table has information about the people who have participated in ski camps. Add this table to analyse information on participant gender and location. - Select the table’s gear .
- Select “GENDER”, “ISOCODE, and “REGION” as the columns. Click the gear on the “PERSON” table to save the changes.

Note: Both the “ISOCODE” and “REGION” indicate a person’s location, just at different granular levels. You will map the iso codes to a list of countries later on.
Join “ATHLETEFACT” table with “PERSON” table
- Select the join icon on the “ATHLETEFACT” table.
- Select “Inner Join” as the Join Type, and “One to One” as the Cardinality. In the Join To drop down menu, select “PERSON”.
- From the “ATHLETEFACT” table, select the “PERSONID” column to join the tables together. Set the operator to “Equal to” and from the “PERSON” table, and select the “PERSONID” column. Click Add, then click Save & Close at the top right corner.

You’ve now completed the Model stage of the View construction. You’ve joined the selected database tables together and chosen which columns will be available for analysis.
Continue on to learn how to edit the format of columns, create hierarchies, and make further adjustments to prepare the View for use.
Preparing the View
- Click on the Prepare section.
Your View will change to a tabular layout, showing you a preview of your data.
Note: The Auto Refresh option can be toggled off. This can be useful when making changes to multiple columns on databases with large data volumes.
Formatting Basic Fields
In this section, you will edit the formatting of multiple columns to make the data more readable and contextually appropriate. For example, you will be making changes such as adding currency prefixes to monetary values, adjusting the number of decimal places, and defining the default aggregations of metrics.
Invoiced Amount
- Open the “Metrics” folder on the left hand side.
- Right click on the “INVOICEDAMOUNT” column.
- Select “Edit Format” from the dropdown menu.

Note: You can also click on the arrow in the column header to get to the “Edit Format” page.
Currently, the field names are the same as the column names in the database. Rename and format them to make them more readable.
Note: Although this isn’t edited in this demonstration, you can also add a description to the fields in the Format section. These can be utilized for usability purposes, especially for self-service Reporting.
- Open the Details section and change the Display Name of “INVOICEDAMOUNT” to “Invoiced Amount”.
This title will appear as the column’s name when you are building or viewing Reports using this field.
Note: You can also double-click on the field to change the field name. - Move to the Format section and change the Decimal Places to “0”.
- Add a Prefix indicating currency. In this example, we use “$”.

Camp Rating
Next, click on “CAMPRATING”.
- Open the Details tab and change the Display Name of “CAMPRATING” to “Camp Rating”.
The metric’s default aggregation is automatically set to “Sum”. In the case of camp ratings on a scale of 1 to 10, a sum aggregation would not make much sense. To better understand how users are rating the camps, analyze the average of the camp ratings. - Change the Default Aggregation to “Average”.

For the following five fields, you will just be changing the titles of the columns to title case for readability. There is no need to make any additional adjustments to these fields.
Camp Region
- Change the Display Name of “CAMPREGION” to “Camp Region”.
Camp Demographic
- Change the Display Name of “CAMPDEMOGRAPHIC” to “Camp Demographic”.
Start Date
- Change the Display Name of “STARTDATE” to “Start Date”.
End Date
- Change the Display Name of “ENDDATE” to “End Date”.
Camp Name
- Change the Display Name of “CAMPDESCRIPTION” to “Camp Name”.
Note: See more information on field settings.
Reference Codes
Reference Codes allow for more meaningful values in Reports with numeric- and text-based data by mapping a code to a descriptive value. For example, a text field that contains 'Y' or 'N' could be mapped to display 'Yes' or 'No'.
Create your own Reference Code to map to the “Gender” field.
Gender
- Change the Display Name of “GENDER” to “Gender”.
- Change the Format to “Reference Code”.
- Select “Create New”.
- Name the Reference Code “Gender” and move to the Values tab.
- Click Populate from data source and change the descriptions to “Male” and “Female”. Click Save.

For the “Demographic” field, you will use an already existing Reference Code instead of creating your own.
Demographic
- Change the Display Name of “DEMOGRAPHIC” to “Demographic”.
- Change the Format to “Reference Code”.
- Select “Demographic” as the Reference Type.
Note: This Reference Code has a custom sort order, custom colors, and custom images. When building a Report using the “Demographic” field, the data is sorted by this custom order. The custom colors and images can be utilized in Charts and filters to ensure values are easily identified and consistent across Reports.
Country
- Change the Display Name of “ISOCODE” to “Country”.
- Change the Format to “Reference Code”.
- Select “Country” as the Reference Type.

Note: In addition to the View Builder, you can also create or edit Reference Codes in the Admin Console or the Report Builder.
Note: See additional information on Reference Codes.
Create a Drill Down Hierarchy
Drill Down Hierarchies allow users to drill down within a dimensional hierarchy by limiting the result set as they move from one level to the next. For example, drill from Year (2022) to Month (August), and so on.
When creating a Drill Down Hierarchy, you need to start from the top level and work your way down. In this example, you’ll create a drill from “Region” to “Country”, so you will start with the “Region” field at the top.
Note: You can create a Drill Down Hierarchy with more than two fields. In this case, if there was a “City” field, you could drill further from “Region” to “Country” to “City”.
Region to Country
- Change the Display Name of “REGION” to “Region”.
- Close out of the Field Settings window.
- Right click on the “Region” field. Hover on Drill To in the dropdown menu. Select “Country”.

The two fields will now show that they're joined in a hierarchy with a gray line.
Note: See drill down examples and how to remove links within a hierarchy.
Note: You can create date hierarchies based on a single date field in your data source. They are ideal for use with time series charts, as they use granularity to dictate day/week/month/year. See more information on date hierarchies.
Change the Date Format
For Date Field Types, you can specify the format to be applied. This will not alter the raw data, just change the way it is displayed.
In this case, you want to show the month and year of the date, with one row per month per year.
Month, Year
- Change the Display Name of “MONTHDATE” to “Month, Year”.
- The Format should be set to “Date”.
- Select “Other” as the Date Format.
This way, you’ll be able to build your own custom date format. - Enter “MMM, yy” as the Custom Date Format.

Now the date “01/02/2023” will display as “Feb, 23”.
Year
For the “Year” column, use the Date Part Formatter that allows us to display part of the date, e.g. Month Name, rather than the full date.
- Change the Display Name of “YEARDATE” to “Year”.
- Switch the Format to “Date Part Formatter”. Select “Year” as the format.

Note: See more information on date formatting.
Create Calculated Fields
Calculated fields let you create new fields based on existing fields. You can use simple calculations, pre-defined functions, or freehand SQL, depending on the complexity of the calculation. When created in the View, they will appear as a pre-existing column, saving the user from having to recreate the field in multiple Reports. Calculated fields can also be useful when used in conjunction with Guided NLQ, providing pre-calculated fields for your users to include in their queries.
Athlete Counter
First, create an “Athlete Counter” to easily aggregate the number of athletes by camp or region. For example, when building a Report with the “Region” and “Athlete Counter” fields, the Report should show the number of athletes from each region.
- Select the
 icon under the list of fields.
 - Select “Calculated Field”.
- Enter “Athlete Counter” as the Calculated Field Name.
- Place it in the “Metrics” folder.
- Type “1” in the text box and select “+Add”.

- Select Save and close the window to save your calculated field.
The “Athlete Counter” field should now be visible in the “Metrics” field folder.
- Right click on the “Athlete Counter” column.
- Select “Edit Format” from the dropdown menu.
- Change the Decimal Places from “2” to “0”.
- Change the Default Aggregation to “Sum”.

- Close the Field Settings window.
Camp Days
In addition, create a field to understand how many days the athletes participate in the camps, on average. You will use a Calculated Field to find the number of days between the Start and End date of an athlete’s time at a specific camp.
To do this, create a Pre-Defined calculated field using Yellowfin’s built-in functions.
- Select the icon under the list of fields. Choose “Calculated Field” from the drop down menu.
- Enter “Camp Days” as the Calculated Field Name.
- Place it in the “Metrics” folder.
- Select the “Pre-Defined” Formula Type.
- Select the “Days Between, HSQL” Function.
- Change the Resulting Field Type to “Metric”.
- Select the fields “Start Date” and “End Date” for the “Start Date” and “End Date”.
- Select Save and close the window to save your calculated field.
Your field should now be displayed in the “Metrics” folder.
- Right click on the “Camp Days” column.
- Select “Edit Format” from the dropdown menu.
- Change the Decimal Places from “2” to “0”.
- Change the Default Aggregation to “Average”.

Note: See another example creating a calculated field.
Create a Filter Group
There may be cases where multiple Reports will need the same set of filters, either pre-defined, or user-prompt. To save you adding and adjusting filters in each individual Report, you can create filter groups in the View.
- Select the icon under the list of fields. Choose “Filter Group” from the dropdown menu.
- Enter “Camp Filters” as the Filter Group Name and place it in the “Dimensions” folder. Click Submit.
- Drag “Camp Region” and “Camp Demographic” into the filter box. Close the window and your Filter Group should appear on the left hand side.

Note: See information on cached dependent filters.
Next, you will move all the fields into relevant folders.
Organize the View
Assigning fields to relevant folders lets you organize your fields in a way that is logical for Report writers. You can group fields differently than how the columns were grouped in the table structure in the data source.
Fields selected in the Model phase will automatically be placed in generic “Metrics”, “Dimension”, and “Time” folders. In the following steps, you will place the fields in new folders.
Note: The field folders are purely for display purposes and contain no forms of security like the Content Folders.
- Select the icon under the list of fields. Choose “Add/Edit Folders” from the dropdown menu.
In the Field Folders popup, you can create new folders, delete existing folders and add fields to existing folders. - Select “Add Field Folder”.
The field will now appear in the list of field folders. - Type “Athlete Details”. Select “Add”.
- From the Select dropdown, click on “Camp”. Click Submit to save.
You’ll see the new folders on the left panel.
Now that the folders exist, we can add fields to them. - Drag “Invoiced Amount”, “Athlete Counter”, “Gender”, “Region”, “Country”, and “Demographic” to the “Athlete Details” folder.
Note: Use your usual keyboard/mouse combination to multi-select them.
- Drag “Camp Rating”, “Camp Days”, “Camp Name”, “Camp Demographic”, “Camp Region”, and “Camp Filters” to the “Camp” folder.
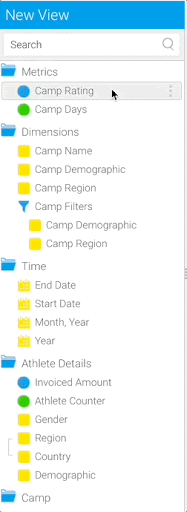
- Keep “Month, Year”, “Start Date”, “End Date”, and “Year” in the existing “Time” folder.
- Delete the “Metrics” and “Dimensions” folders using the red “x” on the right of the folder name.
- Using the burgericon on the left of the folder name, drag and drop “Time” to be after “Camp”.

Publish the View
- Click Publish at the top right corner of the screen.
- Enter “Getting Started View” as the View Title.
- Place it in your “Getting Started with Yellowfin” folder and the “Content” sub-folder.
Note: To delete this version of your View, you can select the down arrow on the More tab on the top right menu. From there, select Delete Version.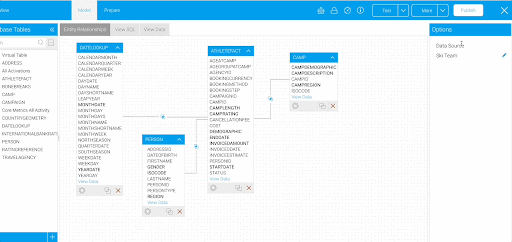
Note: To edit the View, navigate to the Browse page and search for the view in the search bar. Right click on the View and select Edit. Then, select Model. Another page will pop up asking if you’d like to clone or edit the View. We recommend always selecting Clone. This will provide you with a safety net, so if you need to roll back to a previous version of the View, you have the option to do so. See more information on editing Views.
Note: To save the edited version of the View, click “Publish”. Remove the “(Clone)” from the name for best practice keeping your content clear and organized.
You are now ready to create Reports and Charts using your new View.
| Styleclass | ||
|---|---|---|
| ||
...
- Ensure you're in the Prepare tab of your view and that you're using the tutorial view we set up earlier on this page (if not, follow the previous steps)
- Click on the Create tool at the bottom of the screen, then click on Date Function

- From the Create Date Function dialog box, click on the dropdown for Field and click on Invoiced Date

- Click on the dropdown for Date Function and select Month Start Date
You will notice that each time you select something from the dropdown, a sample date is displayed on the right
- Click on the dropdown for Format and select Month Name
- Click on the dropdown for Field Folder and select Date Fields

- Click on the Save button to save your new date field
- Repeat steps 2 to 7 to add a new date field with the following details:
Field: Invoiced Date
Date Function: Year Start Date
Format: Year
Field Folder: Date Fields
Your Date Fields field folder now has two new fields in it, and to keep our date field together, we can move the original date field here too
- Use your mouse to drag and drop Invoiced Date from the Athlete Payment field folder to the Date Fields field folder to complete the hierarchy

...
| Class | topLink |
|---|
Building a drill down hierarchy
The drill down hierarchy lets report users drill down within a dimensional hierarchy by limiting the result set as they select one level to the next. For example, drill from Year (2022) to Month (August), and so on.
When creating a drill down hierarchy, you need to start from the top level and work your way down. In this example, we will create a Year > Month > Date hierarchy, so we will start with the Year field at the top.
- Ensure you're in the Prepare tab of your view and that you're using the tutorial view we set up earlier on this page (if not, follow the previous steps)
- In the field folder section, hover to the right of the Year Start Date field to display three blue dots

- Click on the dots to display a menu and select Drill To to display a sub-menu

As we're drilling from year to month, we need to connect our year field to our month field - Click on Month Start Date in the sub-menu
The two date fields will now show that they're joined in a hierarchy with a grey line
- Hover to the right of the Month Start Date field and click on the dot to display a menu
- Click on Drill To, and then on the new sub-menu item, also called Drill To

The new sub-menu will appear as soon as you have associated any two date fields, as we have already done - Click on Invoiced Date to link our monthly field to our original date field
All three date fields will now be linked from their top level (first in the list) to their lowest, most granular level (last in the list)
Your drill down hierarchy is now ready to be used in reports.
See Drill Down Hierarchies for more information.
...
| Class | topLink |
|---|
Reviewing and publishing your view
At any time when editing your view, you can check the summary information directly from the top toolbar. It's a good idea to check this before you publish a view. In addition, you can access other details, such a security and performance details from this toolbar, and these areas are covered elsewhere in this section of the wiki. We'll just show you the basics of where to find them here.
- Locate the toolbar at the top of your View Builder screen

- Hover over each of the options to see what is available
- Click on the View Info tool
 to display the View Summary dialog box
- Click on each of the tabs to see what information is available, including the general information about the view, which fields it contains, its raw SQL, and any reports using it, which can be useful if you need to edit an existing view and wish to check any reliant content
- Click on the X in the corner of the dialog box to close it
- Click on the Publish button
Yellowfin will now let you publish this view, although if you wish to save it as a draft, that's also possible
- To save the draft, click on the dropdown tot he right of the Save and Publish button

- To publish your new view, click on the Save and Publish button
Yellowfin will save and close the view, and return you to the Browse page, where your view icon will turn from grey (draft) to green (published)
Your view may now be used to create new reports and charts.
...
| Class | topLink |
|---|
Further information
...